The Dollar Index has continued its correction down throughout the passing week, a decline that has started with an upthrust at the first week of 2017.
From the Quarterly and the semiannual charts point of view, this is a testing of the main down trendline that served as a resistance for the past two years, and has finally been broken up (see semiannual chart).
The general picture on the Monthly timeframe and above is still very bullish. This is the 3rd consecutive Monthly bar to penetrate deeply the upper Bollinger band, meaning a strong bullish momentum on this scale. By the current price action we should find here some support probably for further consolidation, or at least a shortening of the thrust on the way down.
As mentioned before, the Yearly bar closed as a bullish pinbar on sloping 8 EMA, very powerful pattern when its High is taken out, which it did right at the first week of the current Yearly bar. The long term target for this pattern is the 115 level (and the stop is huge as well, below the Yearly Low at 91.88).
The Monthly and Semiannual pinbar’s setups are pointing towards the 108 area (see charts).
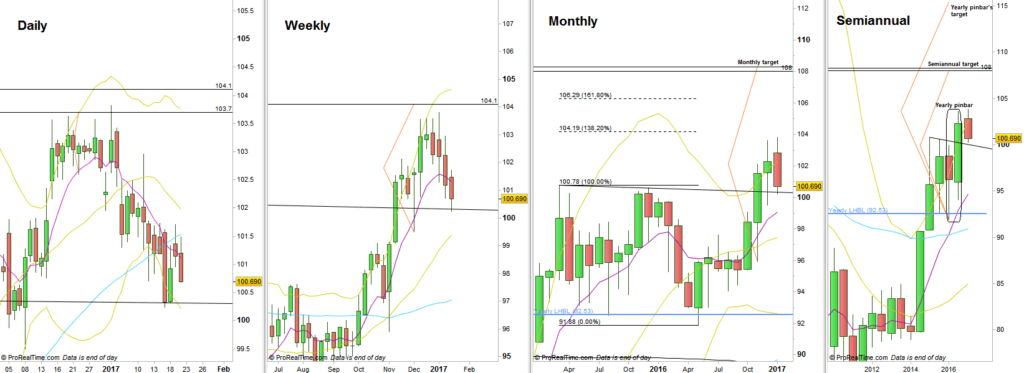
Dollar Index, various timeframes (at the courtesy of prorealtime.com)
Disclaimer: Anyone who takes action by this article does it at his own risk and understanding, and the writer won’t have any liability for any damages caused by this action.