

A narrow range bar was printed throughout the passing week, at the target area (2248) of the bullish Quarterly pinbar on sloping 8 EMA mentioned in the previous reviews. Currently, the reaction is very weak. But don’t let that Doji type Weekly bar misleading you. It penetrated the Weekly upper Bollinger and close above it. Besides, it came right after a very bullish bar that penetrated and closed considerably above that band. In such cases we should take advantage of any retracement to look for signs of strength and a good bullish setup for targets, in this case of 1:1 on the 4H and Daily timeframes. As seen currently, extra care is needed as the market has reached the extension level of 138.2% of the Whole decline throughout the past two years, and we might see more sideways action on the bigger timeframes – on the current area.
If we look at the mega picture, we are almost at the target of the huge false breakdown occurred throughout the years 2008 and 2009 (the bearish market of year 2008), pointing at 2300 as the target. This is also the Daily post election day’s pinbar target. Slightly (in these terms) above it is the level of 2330 which is pointed by couple of important signals. The Quarterly bullish pinbar of the 1st quarter 2016, the Weekly false breakdown also a pinbar, also an engulfing pattern, and the engulfing pattern made by the previous week and got the thrust up last week – all these important signals point at the 2330 area as their targets. All these targets should most likely create a mass of Long covering, and we should see some considerable retracement there. The 161.8% extension of the last two year retracement lies at the level of 2338.
12 points higher, at 2350, is the target of the Quarterly bullish follow through, and 2400 is the target for the bullish Monthly pinbar on last November that has already got a thrust up above its High at the current month. Again, Notice the targets at 2330 as important resistance.
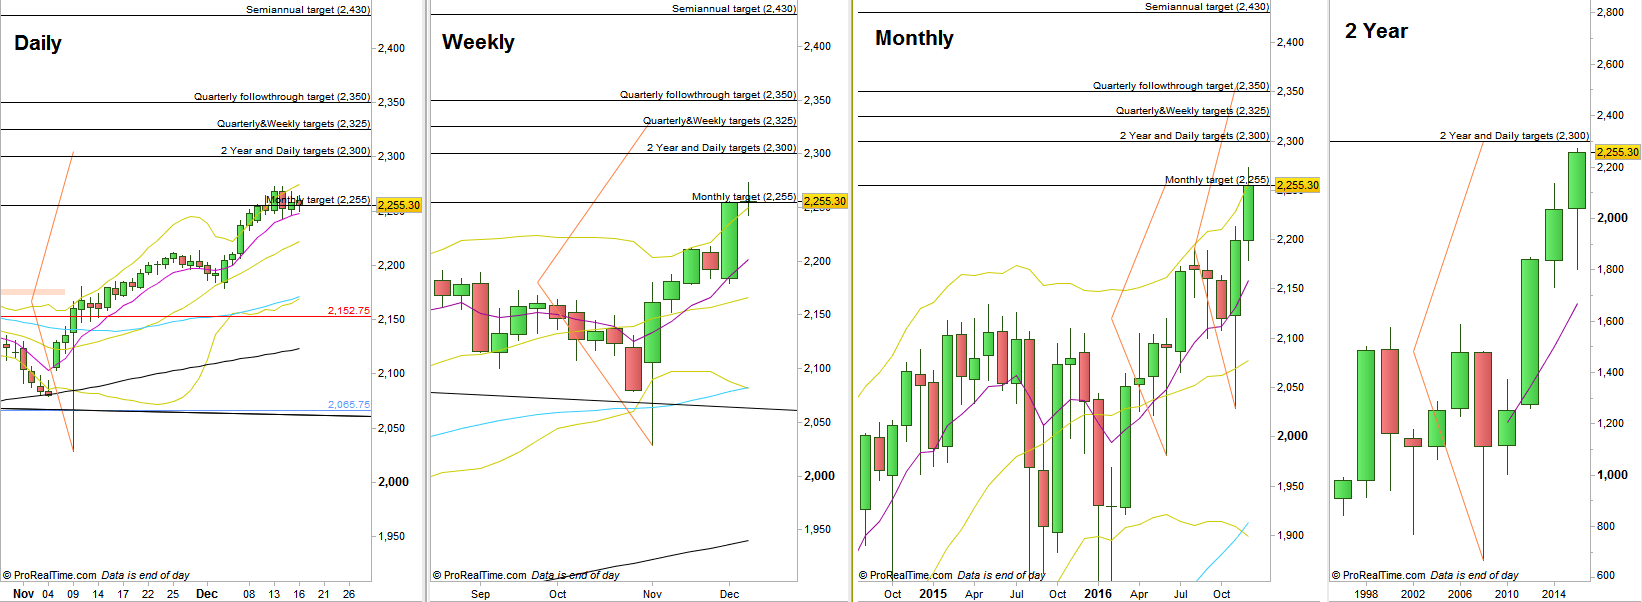
S&P Futures, Daily, Weekly , Monthly and 2Year charts (at the courtesy of prorealtime.com)
Disclaimer: Anyone who takes action by this article does it at his own risk and understanding, and the writer won’t have any liability for any damages caused by this action.
