
The volatility the market created during last Wednesday, the day after the elections, – was huge. It has been so far the biggest Daily bar this year. Although I was skeptic that the prices would reach the full target of the bearish setup at 2030 mentioned in the last review, the market eventually did reach the target fully, i.e. not only testing the famous down trend line mentioned many times (and the mid Weekly Megaphone pattern), but reached 2028.50, almost the 78.6% retracement level of the post Brexit bullish wave.
The bearish move was very challenging to trade even on the 30 Minutes timeframe, not to mention bigger timeframes, as the week has started with a gap up. In such cases it is better to wait for the gap to close, then looking for new signs of weakness. But here, it was very fast and more like big a shakeout move planned by the big money. This is another proof that we as retail traders can never fully “understand” the market by fundamental issues or news solely, as the big money is carrying its plan anyway, pre-planned. Even when there is some surprising development for the big money, it takes time for them to accumulate or distribute before the real market move justifying this development does begin, a process which is usually very misleading.
The Weekly bar ended finally as a pinbar penetrating the lower Bollinger band, – closing as a bullish pinbar engulfing the previous eight (!) bars. It also took out the most important LHBL of the last 2 month correction at 2172.75.
The Monthly bar is currently a bullish pinbar on a sloping 8 EMA short term sentiment line, a very bullish picture. But, don’t forget that we are only at the middle of the month, so there is nothing to be impressed by it currently.
The same goes for the Quarterly bar, currently a bullish pinbar on the sloping 8 EMA, but don’t forget that it is still a LL LH bar.
Taking out the Weekly High is a bullish signal to reach the same magnitude of the Weekly pinbar’s range, i.e. the 2330 area. If that happens in the coming week, most likely the price won’t take out the all time High, and may spend much more time inside the current range. So, I wouldn’t recommend going long before the all time High is taken out, or after an inside Weekly bar is printed (i.e. only on the week after). Pay attention that the 2330 target is slightly above the already given bullish signal of the 2016 first Quarterly bar which was a pinbar on a sloping 8 EMA, target at 2323.
The most interesting observation for the election week IMHO, is the behavior of the Nasdaq, which was considerably weaker than the primary market (SP500) and the blue chips (DOW). This is important because the Nasdaq has been the locomotive of the last two bullish markets 2003-2007 and 2009-today, yielding much more that the SP500 and the DOW.
When the locomotive doesn’t pull the market at an important reversal, it is a preliminary indication that the market might be before a mega turn, but this doesn’t mean that we won’t see first the 2330 level area being achieved, and sure we need more indications before turning our bias into a bearish market one.
The Daily timeframe shows a clear shortening of the thrust. Last Thursday ended as a stopping action bar, and the inside bearish bar of Friday means that the market is not ready to climb yet, at least not before a false thrust down back to the Daily 50 SMA below. More than that, don’t be surprised to see much more consolidation in the current Weekly range for the coming weeks.
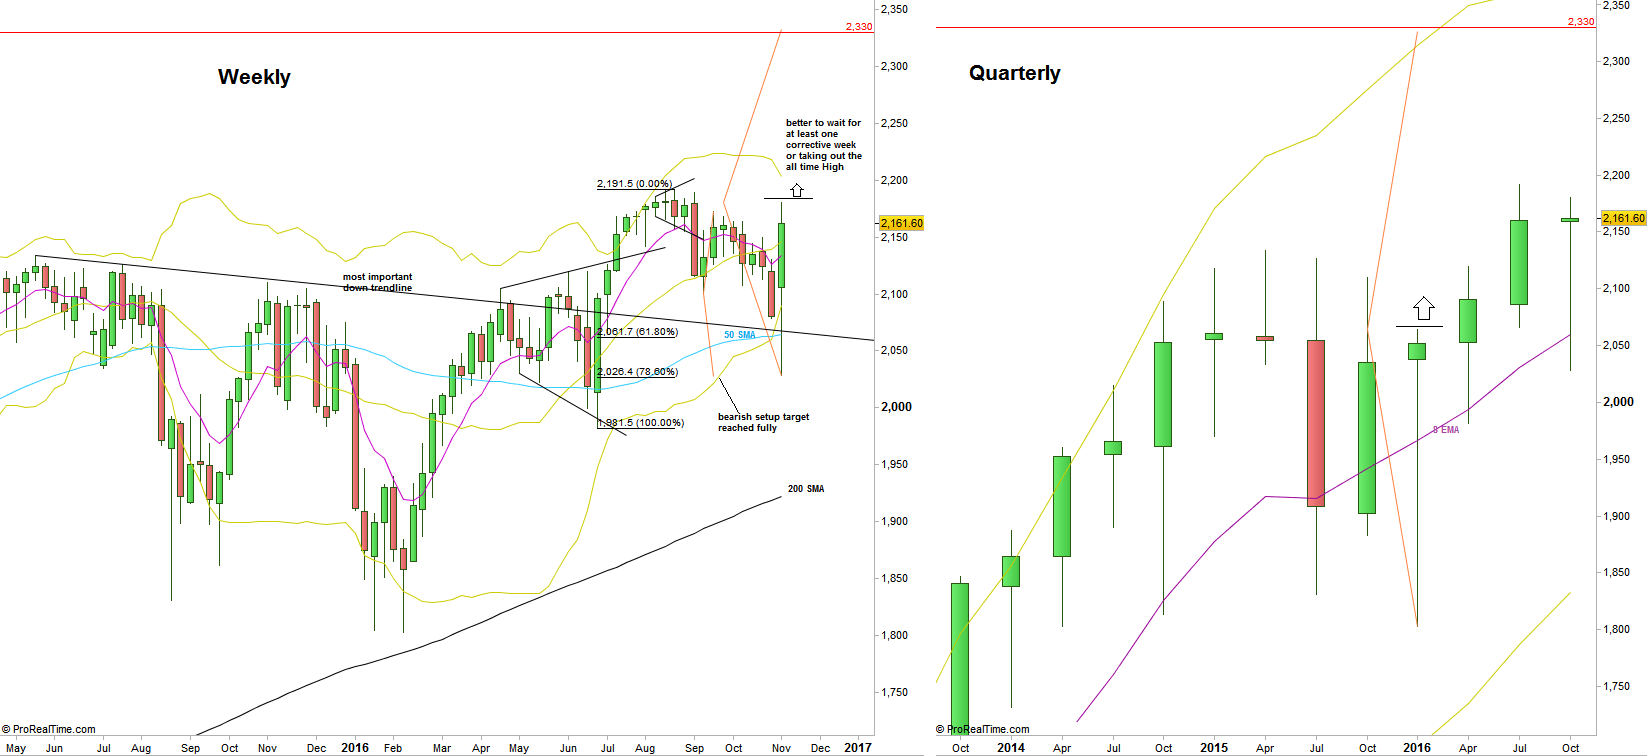
S&P Futures, Weekly and Quarterly charts (at the courtesy of prorealtime.com)
Disclaimer: Anyone who takes action by this article does it at his own risk and understanding, and the writer won’t have any liability for any damages caused by this action.
