

Last Tuesday, the market signaled a bearish move by taking out the Monthly Low at 2100.25. The target of this signal is towards 2030, but this is a countertrend Weekly signal that might not achieve its target fully.
Do doubt that the general picture from the Daily up to the Monthly timeframes is pretty bearish. The Weekly bar ended as a bearish Marabuzo bar, the Daily hasn’t found a support on the Daily 200 SMA and closed below it. The Down trend line mentioned in past reviews seems quite achievable, currently lies at the 2055-2060 levels. Currently, this area is also converging with the Monthly 20 SMA, mid Monthly Bollinger bands, and the Weekly 50 SMA. It is also the 61.8 retracement level of the last major bullish wave. Those who remember the Megaphone pattern issues, -it is probably the testing of the big megaphone chart, back in its middle.
Most likely the Quarterly Low at 2065.75 is going to be taken out, but the real question is how the whole Quarter is going to close by the end of this year – whether a Quarterly bearish reversal down (which IMHO less likely to happen), or as a false thrust down, ready for the next bullish move towards the 2250-2300 area.
A good bearish opportunity to join the current Daily swing down move might come tomorrow, Monday, if the market makes a false thrust up, i.e. taking out the Daily High at 2094.25, reaching the Daily 8 EMA from below following by an Hourly reversal down.
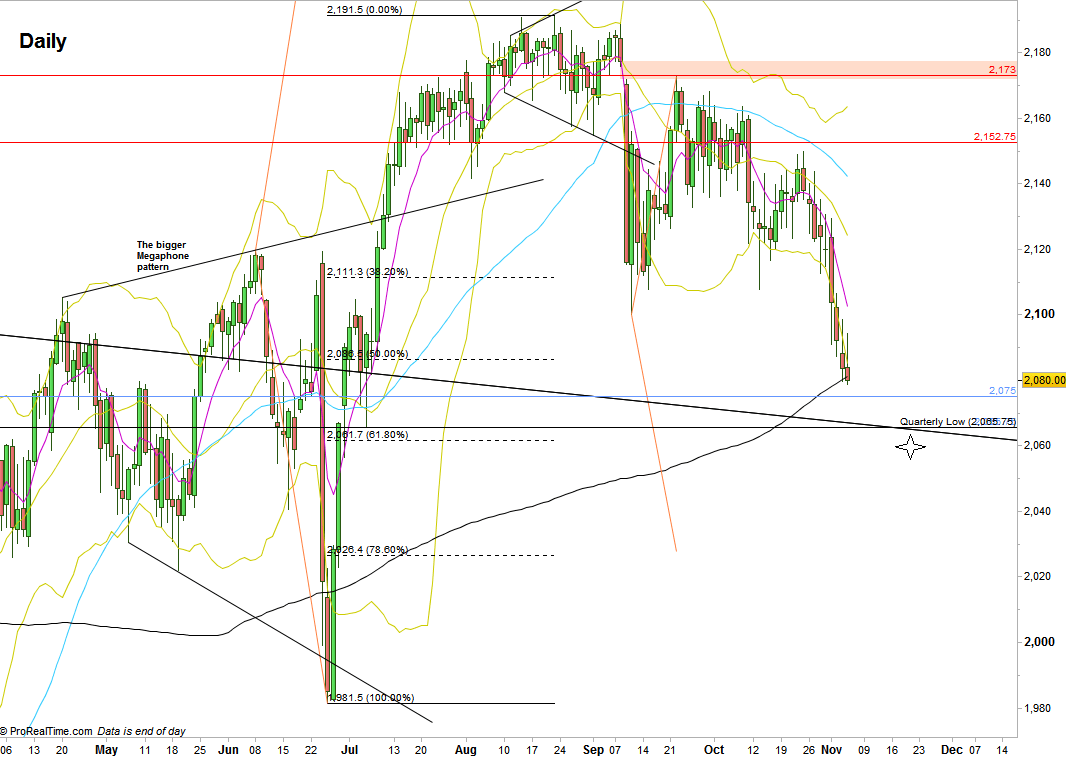
S&P Futures, Daily chart (at the courtesy of prorealtime.com)
Disclaimer: Anyone who takes action by this article does it at his own risk and understanding, and the writer won’t have any liability for any damages caused by this action.
