
The passing week ended as an inside, relatively small range Weekly bar with a bullish body, something like “I’m not that strong, but neither am I in a hurry to decline”. As for the current price action, most likely the current month is going to close as an inside bar, probably tends to be bearish.
The market did take out the Daily Low of the previous Friday at 2122.25, a signal to go short till the Monthly Low, but it took only one day of bearish sentiment, before the prices reversed to stay in the Weekly range.
Pay attention how important was the distinction about the behavior of the prices vs. the Daily lower Bollinger band, per the last review. Anyone who shorted the market based on the Daily bearish pinbar signal should have seen after last Monday that there is a lack of thrust down – the prices did penetrate the lower Bollinger band, but closed above, combined with the behavior of the previous days – that was a warning sign to close the trade closed to the entry point, or above Monday’s High at most.
The current behavior calls for more consolidation in the current Weekly range. Prices can easily go up to test the Daily 50 SMA above 2150 approximately, and the support above the 2100 area.
Nothing has changes as for the boundaries for the midterm directions. In order to be bullish midterm, the market needs to close the open gap above, to correct, and then to show new signs of strength. In case the Monthly Low is taken out, it is a bearish signal that might challenge the Quarterly Low at 2065.75, reaching the Monthly 20 SMA (mid Bollinger Bands), dealing with the previous all time High important down trend line, and the mid Weekly Megaphone pattern (see the previous Weekly reviews).
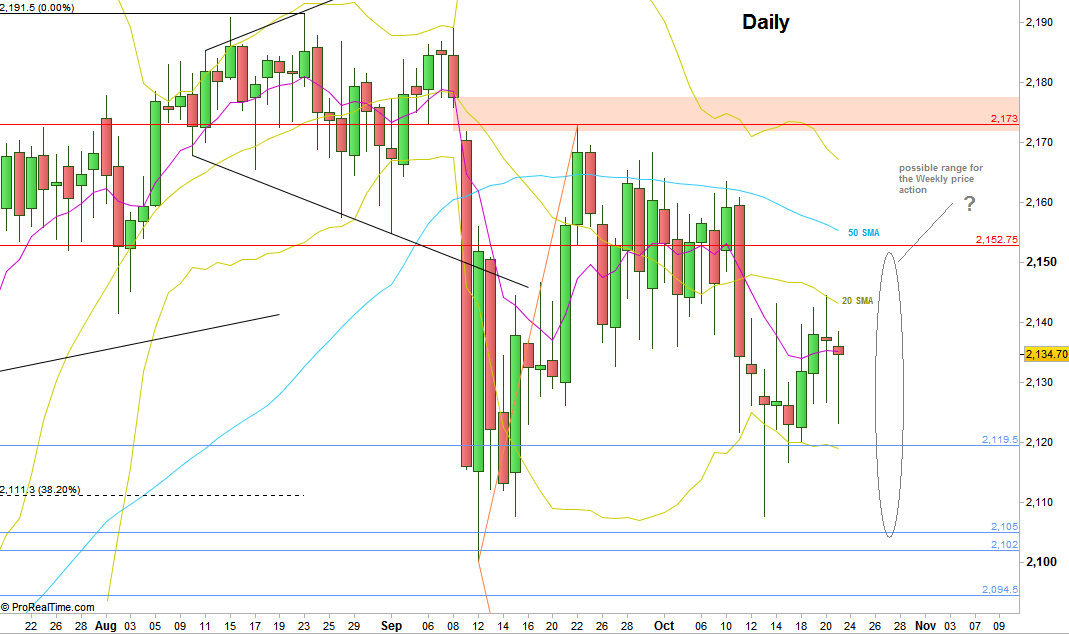
S&P Futures, Daily chart (at the courtesy of prorealtime.com)
Disclaimer: Anyone who takes action by this article does it at his own risk and understanding, and the writer won’t have any liability for any damages caused by this action.