

The most important Low mentioned in the past reviews – 8518.15 has been taken out. As said before, had the market made a reversal up above that Low, it would have been a clear sign of strength that could drive the prices rapidly up, even to a new Monthly High. Since that eventually didn’t happen (the Low at level 8518.15 had been taken out), then we may already be in a big Monthly correction (i.e. the Monthly High at 8968.7 is by most chances the High of this correction).
As for the bearish side, consider carefully the fact that the Bearish flag mentioned on the last review didn’t reach its full target. More than that, it was followed by a bullish Kicker pattern last Tuesday (a Bullish Kicker pattern is a bearish bar followed by an open gap and a very bullish bar), leaving an open gap at 8520.4-8555.9.
If we look at the Weekly picture, the passing week ended as a bullish pinbar on the sloping 20 SMA (mid Bollinger Bands), closing above the 8 EMA short term sentiment line (sign of strength).
Taking out the Weekly High is a signal of 1:1 with the Weekly pinbar’s magnitude, i.e. to reach and challenge the open gap left closely to the last Monthly High, levels 8936.8-8952.5. The stop level is below the Weekly Low, at 8506.35.
Since there is an important open gap on that way up, levels 8806.35-8831.55, I would recommend going long on a partial signal currently: Taking out the Weekly High is a good bullish signal to reach the 8800 area, right below this open gap, perhaps challenging it. The stop level in this case is below last Friday’s bar, 8652. Failing to reach the open gap, i.e. failure in taking out the level of 8806.95 and a Weekly reversal down later on, would be clear signs of weakness, and possible development of the bearish move (Monthly correction).
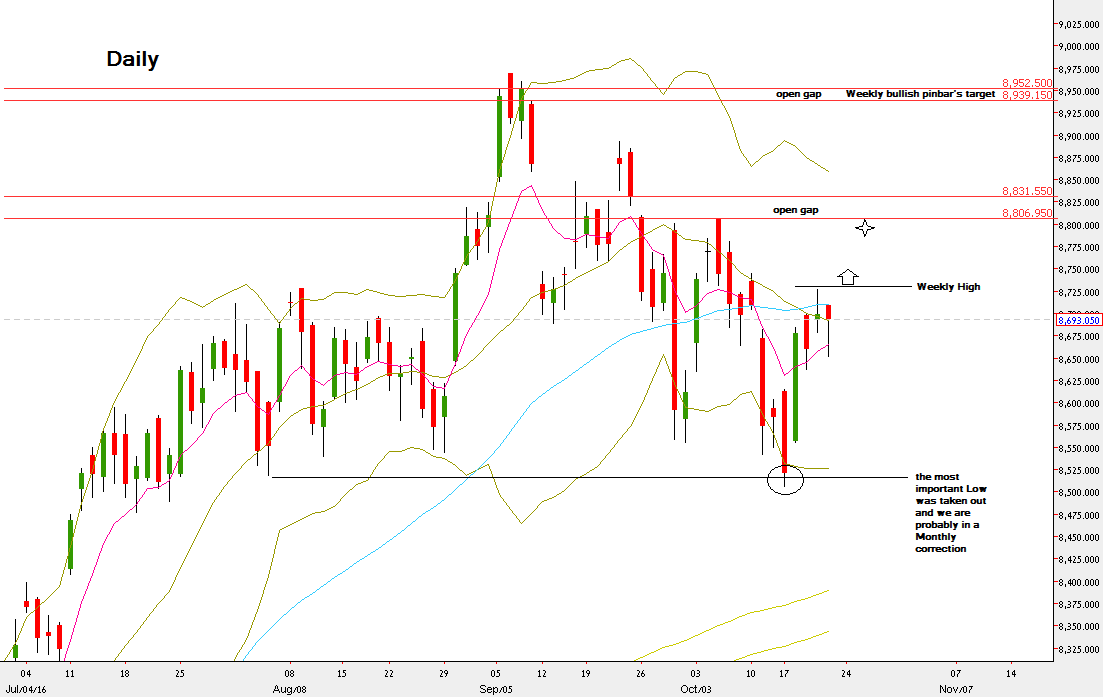
NIFTY Futures, Daily chart (at the courtesy of netdania.com)
Disclaimer: Anyone who takes action by this article does it at his own risk, and the writer won’t have any liability for any damages caused by this action.
