A LH LL Weekly bar printed for the S&P futures, with much choppier price action compared to the previous weeks.
The passing week has continued the signs of weakness seen lately – by starting with a failed attempt to close above the Daily 50 SMA, followed by a sharp move down on last Tuesday. Finally, last Friday’s Daily bar ended as a bearish pinbar on sloping 8 EMA, pointing down.
A thrust down below the Low of Friday, 2122.25, is a good bearish signal with a magnitude of the pinbar’s length, into the clear area of support at 2102-2105, challenging the Monthly Low at 2100.25. Currently, there are more chances to respect the Monthly Low and stay inside the Monthly range for the coming week.
Taking out the Monthly Low, as mentioned in the previous reviews, is a bearish signal that might challenge the Quarterly Low at 2065.75, reaching the Monthly 20 SMA (mid Bollinger Bands), dealing with the previous all time High important down trendline, and the mid Weekly Megaphone pattern.
However, per the way the price action is behaving currently, the last Daily bars except for Thursday didn’t manage to touch the lower Bollinger band. So it wouldn’t be surprising that the first or second Daily bars of the coming week might take out the Friday’s High rather than its Low, probably reaching the Daily 20 SMA (mid Bollinger Bands), and the next resistance above is a strong one, at 2152.75-2156, closed to the Daily 50 SMA.
Currently, Daily swing bullish ideas should be considered (assuming that the Monthly Low remains respected) – only after taking out the Weekly swing High at 2172.75, closing the open gap above (2172.75 till 2177.5), retracing and continuing with a follow though up.
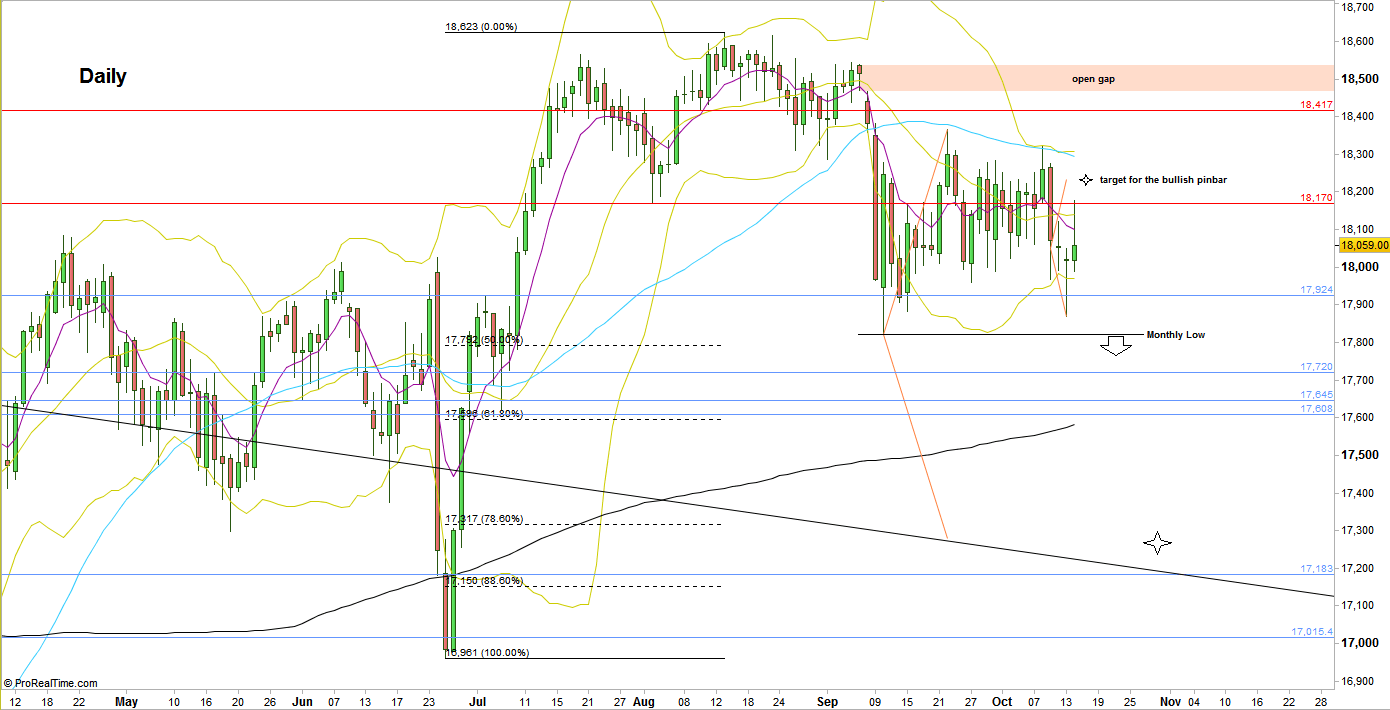
S&P Futures, Daily chart (at the courtesy of prorealtime.com)
Disclaimer: Anyone who takes action by this article does it at his own risk and understanding, and the writer won’t have any liability for any damages caused by this action.