

After the change of behavior by the previous Weekly bar, the passing week ended as an inside bar with some kind of strength, as it closed slightly above the Weekly 8 EMA short term sentiment line, and managed to leave an open gap below. This behavior is not that bullish, but not so bearish either – in case one was impressed by the previous week’s bearish bar. There is some chance to see at least an upthrust to challenge the open gap above the Weekly High.
There are two open gaps, from above and from below, which raise the chances of not having a strong move to either side (Most likely after closing an open gap which lasts more than one bar the market reacts and corrects back).
The bearish opportunity might emerge actually from the price action above the range, for example taking out the Weekly High at 8809.55 (needless to say taking out the inner week’s High at 8806.35 only) not closing the entire gap above 8809.55-8831.55, and closing rather weak (e.g. a bearish pinbar), then a thrust down the next day can be a good short signal.
Taking out the Low of last Friday at 8863.90 not before coming Tuesday is also a bearish signal, but the open gap below 8611.15-8635.15 needs some consideration as well.
Any decline below the Monthly Low at 8555.35 that doesn’t take out the Low at 8518.15 within the same Daily momentum is a clear sign of strength and is questionable as per the readiness of the market to decline for the midterm. Pay attention to that distinction, as the Weekly 20 SMA is currently laying right there.
On the other hand, taking out the 8518.15 Low means by most chances a continual bearish momentum and getting a support only at the 8420-8470 level area, with a good chance for a midterm bearish sentiment.
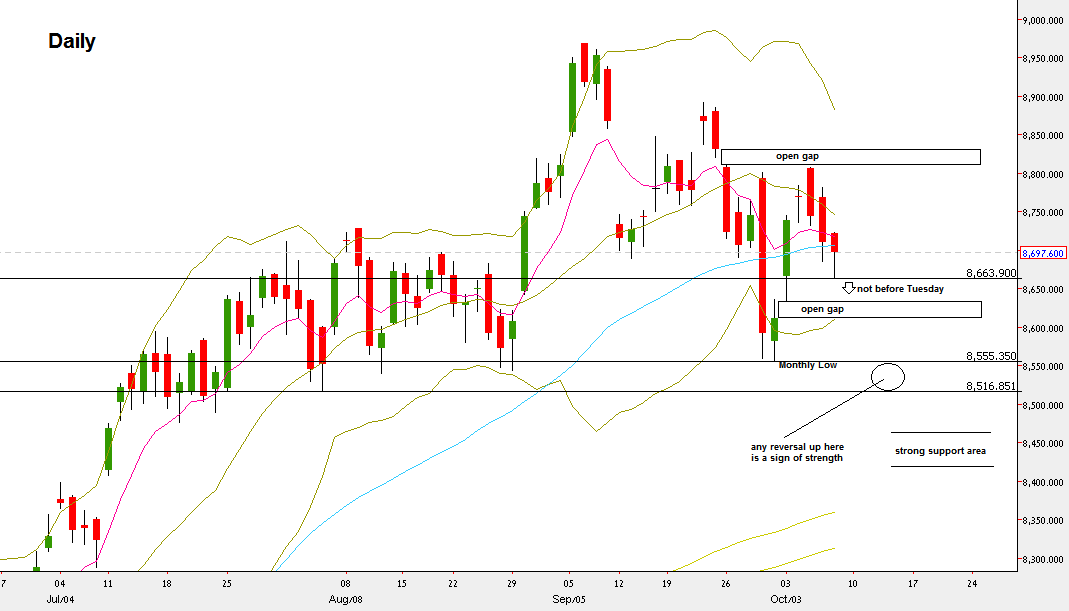
NIFTY Futures, Daily chart (at the courtesy of netdania.com)
Disclaimer: Anyone who takes action by this article does it at his own risk, and the writer won’t have any liability for any damages caused by this action.
