
Unlike other stock markets, the American main indices closed a narrow range week, an inner bar of the previous week (or 2 weeks as in the Nasdaq and Russel). The Dow wasn’t different.
More than that, the whole Weekly price action was inside to the previous Friday’s bar, September 30th, and it took place on a week in which one of the major volatility causing reports is released, the Non Farm Payroll report …
We are currently in the middle of the range, the most random place for the price to be for the relevant timeframes, in this case, the 8 Hours till the Weekly.
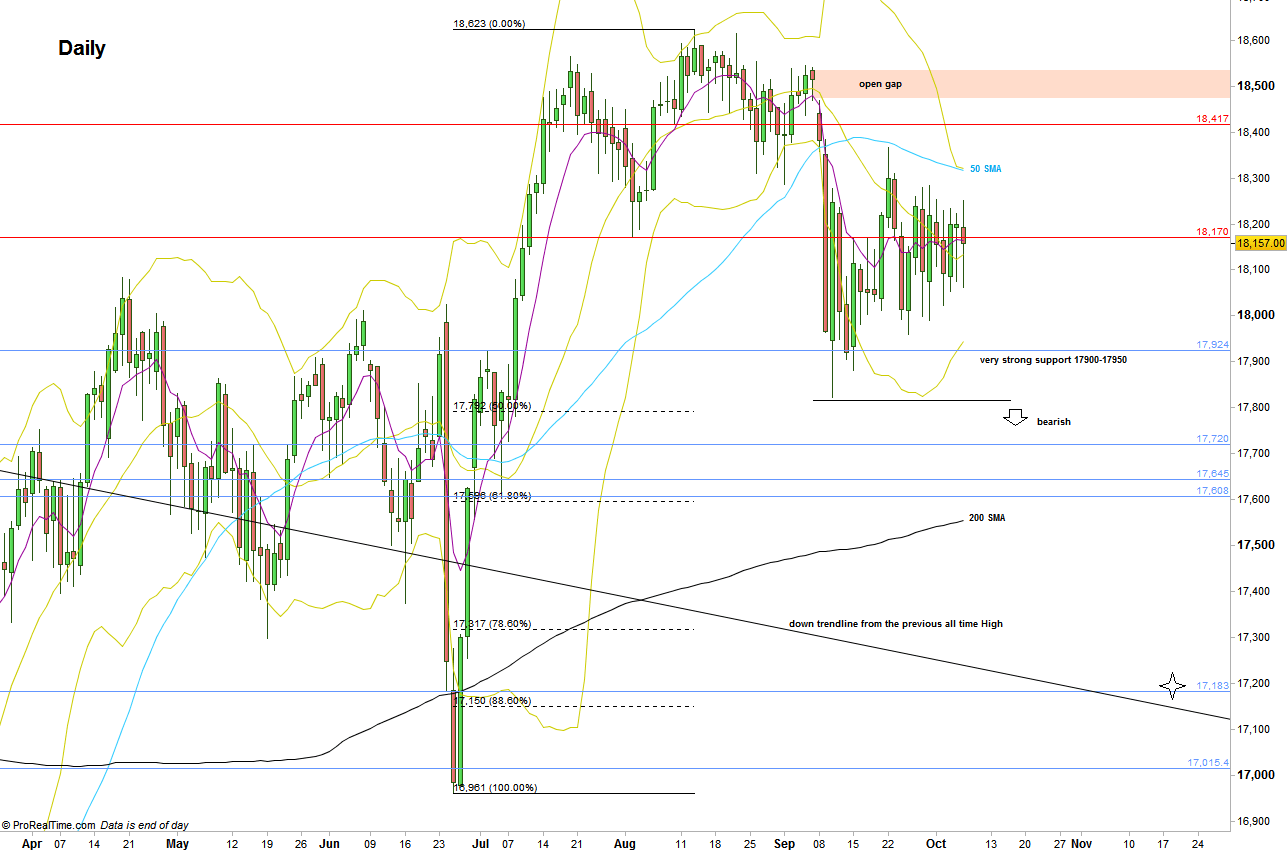
As of price action, more chances are to for down side much because the behavior of the Weekly and Monthly timeframes. The barriers from above are the Weekly High (ignore the Inside bar) at 18283, and the Daily 50 SMA above it. A Daily bar that takes out the Weekly High, touching at the Daily 50 SMA (~18310) but closing weak can turn into an upthrust, and a good bearish opportunity will be on a thrust down the next day.
On the down side, pay attention to the strong support at the 17900-17950. Most likely the price wont pass this area easily, and we may be bound to another one or more narrow range weeks.
Taking out the Monthly Low at 17822 is a bearish setup to reach the 17200-17300 area, right on a clear downtrend line taken from the previous all time High. It is also a 138.2% projection of the bearish wave that has been made so far (with the projection’s High at 18366).
Disclaimer: Anyone who takes action by this article does it at his own risk and understanding, and the writer won’t have any liability for any damages caused by this action.
