The Dow Futures closed the Quarterly bar with a wide wick above. The Monthly bar closed as a LH LL bar, in the middle after the last 3 Monthly bars didn’t manage to touch the upper Bollinger band. The Weekly bar closed on the 8 EMA short term sentiment line, but as a LH LL bar.
So far the correction covered almost 50% of the last bullish wave, the one that has followed the Brexit decision and made a new all time High eventually.
Currently the price action doesn’t look strong, but is not ready to decline fast – either. Most likely by the current price action, we are going to stay in the current Daily range 17822-18366 for another week – at least.
Taking out the Monthly Low at 17822 (as mentioned above it is not very likely to happen in the coming week) is a bearish setup to reach the 17200-17300 area, right on a clear downtrend line connected the previous all time High with the next Lower High around. It is also a 138.2% projection of the bearish wave that has been made so far.
The way down to that trigger point at 17822 – is full of obstacles and support levels, so in this case it is recommended to wait for the Monthly Low to be taken out before entering a bearish position in the Daily timeframe.
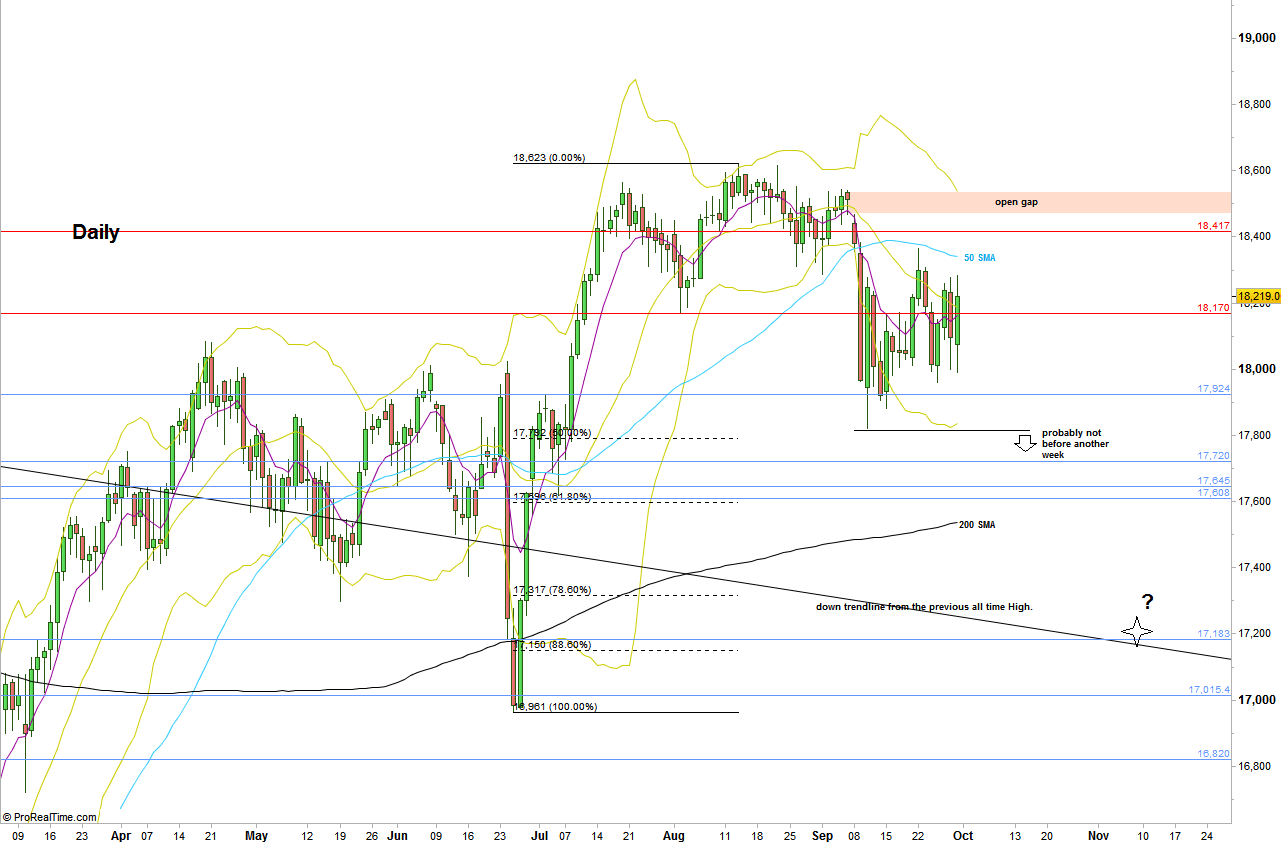
Dow Futures, Daily chart with main support and resistance lines (at the courtesy of prorealtime.com)
Disclaimer: Anyone who takes action by this article does it at his own risk and understanding, and the writer won’t have any liability for any damages caused by this action.