4 Major factors warn the Market decline isn’t over yet

Last week’s stock market rebound was driven by an 11.4% weekly jump in Apple (NASDAQ: AAPL), as iPhone 7 momentum picked up, lifting the tech-heavy Nasdaq 100 2.9% for the week. The other major indices made a modest recovery following the prior week’s sharp decline.
At the sector level, last week’s advance was predictably led by technology (2.3%), but defensive utilities (1.7%) and health care (0.8%) also performed well.
Spooked Investors Warn of a Deeper Decline
Despite last week’s splashy tech rally, investors are still apprehensive, if not outright afraid. The Volatility S&P 500 Index (VIX) finished last week at 15.37, well above its 50-day moving average at 13.01. I use the 50-day as a baseline to distinguish between a confident and nervous market.
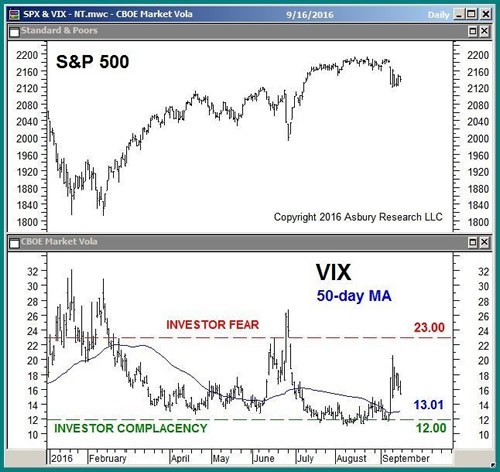
As long as the VIX remains above 13.01 this week, it will warn that the market is vulnerable to a deeper decline.
Seasonality Also Warns of Near-Term Weakness
Seasonality statistically defines the historical performance of an asset at various times during the calendar year. Based on data since 1957, the benchmark S&P 500 historically peaks for the month of September on the 11th trading day, which was Sept. 16. And it historically bottoms for the month on the 20th trading day, which will be Sept. 29.
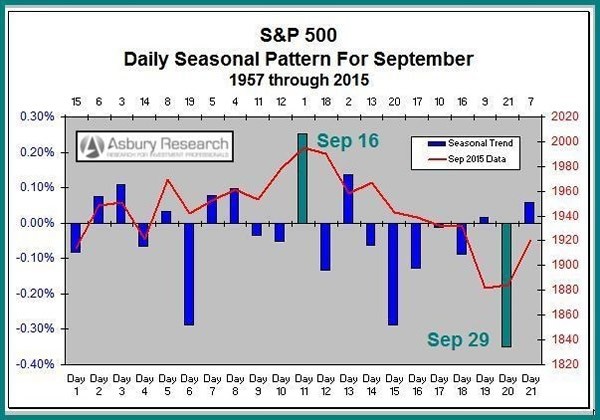
According to 60 years of data, the market is vulnerable to more weakness through the end of the month before a fourth-quarter rebound emerges (see Aug. 1 Market Outlook).
Know Your Index Levels
Now that we know investor fear and seasonality point to more weakness through the end of the month, the next thing investors should know is where the key support levels are.
The chart below defines key levels of underlying support in the S&P 500. We can see the index hovered just above 2,121 to 2,104 all of last week. This formidable band of support represents four minor peaks in the index set between Nov. 3 and June 8.
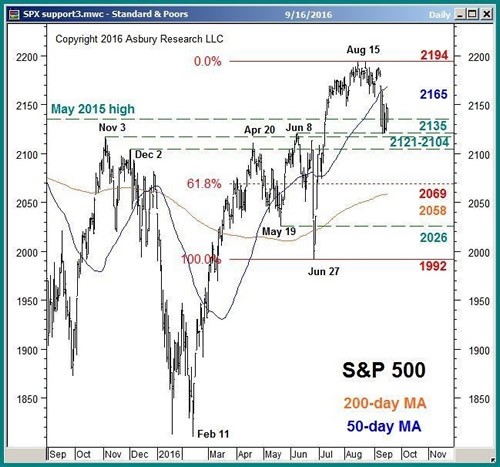
A sustained breakdown below 2,104 this week — especially if the VIX remains above its 50-day moving average — would set the stage for a deeper decline, potentially down to the next key support level at 2,069 to 2,058. This level is situated 6% below the index’s mid-August highs and represents the 61.8% retracement of the June-to-August advance and the 200-day moving average (major trend proxy).
Rising Long-Term Rates Actually a Good Sign
In last week’s Market Outlook, I pointed out that the recent decline in iShares 20+ Year Treasury Bond (NASDAQ: TLT), which moves opposite to long-term U.S. interest rates, had positioned the ETF right on top of important underlying support at the $ 135.25 February high. I said a sustained drop below $ 135.25 would clear the way for a potential test of the ETF’s 200-day moving average at $ 131.29.
Support at $ 135.25 was indeed broken last week, setting the stage for a deeper decline. The 200-day moving average is now situated at $ 131.61, which is 2.3% below Friday’s close.
Initially, rising long-term interest rates are likely to have a negative effect on stocks, as they suggest the Federal Reserve will no longer be protecting investors from a protracted market decline. But I believe the more intermediate-term market reaction will be positive, as rising rates indicate the Fed is finally becoming confident in the prospects of upcoming economic strength.
Oil Prices Breaking Down
West Texas Intermediate (WTI) crude oil prices nearly doubled during the first half of the year, peaking at $ 51.23 on June 8 before spending the rest of the summer drifting sideways as the market digested those gains. Now, however, it appears that a meaningful top may be in place at those June highs.
The next chart plots the PowerShares DB Oil ETF (NYSE: DBO), which is intended to reflect changes in market value of light, sweet crude oil (WTI). It shows the ETF is starting to break down from three months of sideways, coiling price activity, which represents investor indecision.
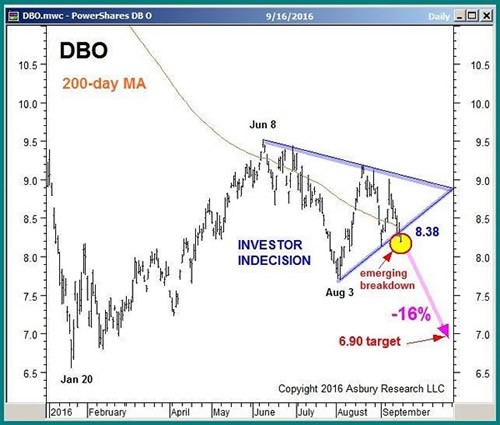
A sustained decline below the indecision area’s lower boundary at $ 8.38 would confirm that a significant peak is in place at the June 8 high and would target a move to $ 6.90 — 16% below Friday’s close. Should this breakdown be confirmed, it could help to trigger a deeper near-term decline in the stock market.
Putting It All Together
Elevated market volatility, September seasonality, the recent rise in long-term U.S. interest rates and declining oil prices collectively warn of a deeper stock market decline between now and early October. Bigger picture, however, the major trend in the broader market index will remain positive as long as underlying support in the S&P 500 at 2,069 to 2,058 is not meaningfully broken.
Additionally, even if investors have an adverse reaction to an interest rate hike initially, I believe that slowly rising long-term rates could eventually turn out to be a positive for the market. They would indicate the extremely cautious Federal Reserve is confident about the prospects for a stable and strengthening economy.