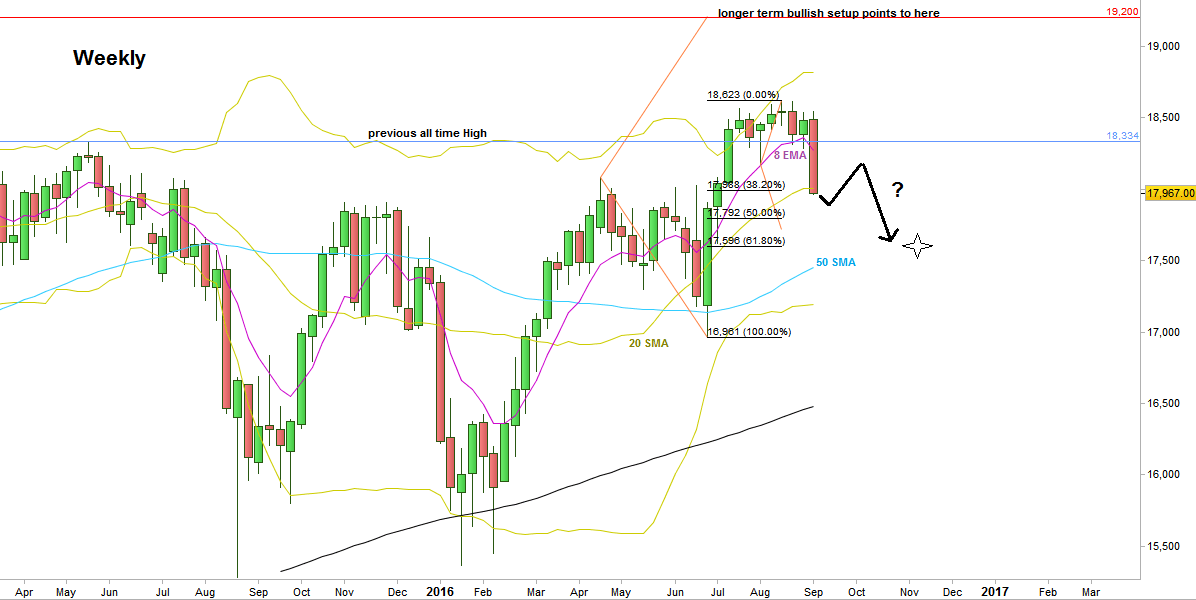
The market has changed mood completely throughout the passing week. The week has started with a negation of a previous bearish setup, i.e. turned bullish as suggested in the last review, but this thrust up held for only one day, has turned false before a sharp decline down, mainly on last Friday. The above price action left an Upthrust on the Weekly chart (a false thrust up above a range before a sharp decline down, in this case on the Weekly chart), and this is midterm bearish behavior.
The weakness is shown also by closing the Weekly bar below the Weekly 20 SMA, the mid Bollinger Bands. Also notice that the market didn’t respect the 38.2% retracement level of the last Monthly bullish wave, and closed below it.
Currently there is a bearish setup to reach at least 50% of the last Monthly bullish wave since the Brexit news, last June, at 17800 level. The problem is that most of the way down has already been made, and we are above an important support (17830-17924).
I would recommend to wait for a consolidation and correction up, of at least two weeks before following new signs of weakness, whereas in this case the bearish setup can reach also the 61.8% retracement level of the same bullish wave, at 17600.
For the longer term (Quarterly and above), the market is still bullish. So far, it looks as if the break up above the previous important all time High of 18334 was a faked break as the passing week was the first to close below that level since the break up to make a new all time High. But, looking on the bigger timeframe, there are much more chances to see eventually a new all time High (i.e. at least 19200 for which there is currently an active bullish setup to get to) than for this last all time High (18623) to be a top level prior to a big bearish market.
Disclaimer: Anyone who takes action by this article does it at his own risk and understanding, and the writer won’t have any liability for any damages caused by this action.