
The Dollar Index made a quite surprising move during the passing week closing strongly above the Weekly 50 SMA, penetrating the Weekly upper Bollinger Band and closing above it.
In the previous reviews I mentioned the Quarterly bullish pinbar over the sloping 8 EMA, in which a HH above should indicate a false thrust down on the big range since March 2015.
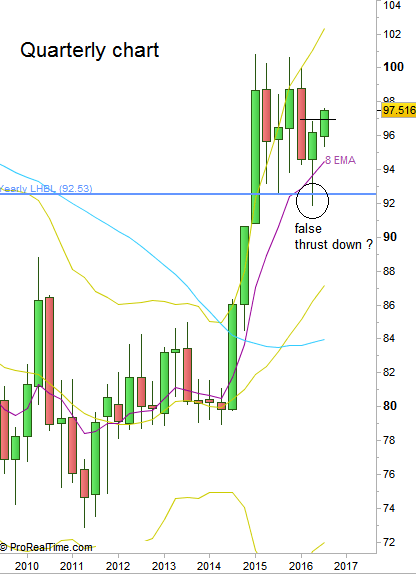
Currently it is “the moment of truth” as for the midterm direction. Continuing strongly above 97.8 or making a shallow correction followed by a Weekly Higher High eventually (=a Follow Through) should indicate by most chances that the Dollar Index is midterm bullish or by most chances should stay at the upper part of the range (96 – 100), hence the Elliot Wave count suggested in the previous reviews is invalid.
If the current price action is a manipulation of smart distribution, it should be seen right ahead this coming week by opening the Weekly bar with a gap down and closing it weak, or by making a Weekly bearish engulfing pattern whereas the room for a topping price action above the Weekly high is very narrow (not higher than 97.8).
Drilling down into the Daily timeframe, taking out the Thursday’s Low at 96.765, followed by a daily correction up that doesn’t take out the Weekly Swing High, then a follow through down (sketched) can be a good indication that the whole price action of last week was a manipulation, and is a good level to build a midterm short position.
Otherwise, any correction down that is followed eventually by a Weekly HH is very bullish and the price is most likely heading towards the 98.6 level area, above the next Weekly LHBL.
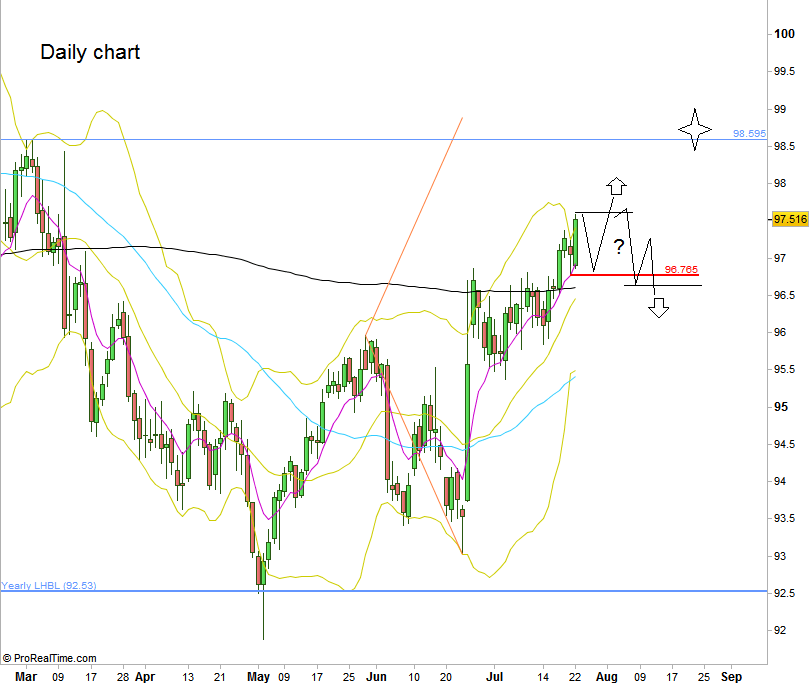
Dollar Index: Daily chart (at the courtesy of prorealtime.com)
Disclaimer: Anyone who takes action by this article does it at his own risk and understanding, and the writer won’t have any liability for any damages caused by this action.
