

After the relative small range Weekly bar that seemed to halt the bullish momentum two weeks ago, the market proved how strong it was by continuing with a very decisive bullish week, started with a gap up, no single LL, nor a single LH on the Daily timeframe.
There are many chances to see it the coming week continuing the bullish move by taking out at least the level of 8621.55.
The most important indication for the market to be long term bullish is taking out the 2 month LHBL line, at 8654.75. In case the market takes out the 8654.75 level, any bearish move followed that doesn’t take out the Low at 6825.8 should be treated for the long term as a correction before going higher.
In such kind of a price action, there are many chances for the market to turn down in between these two levels (8621.55 and 8654.75). Currently, it won’t be considered as bearish for the longer term, not even by taking out the Monthly Low.
Slightly above the 2 month LHBL line is the last major resistance at 8669.45, -before the all time high at 9119.2.
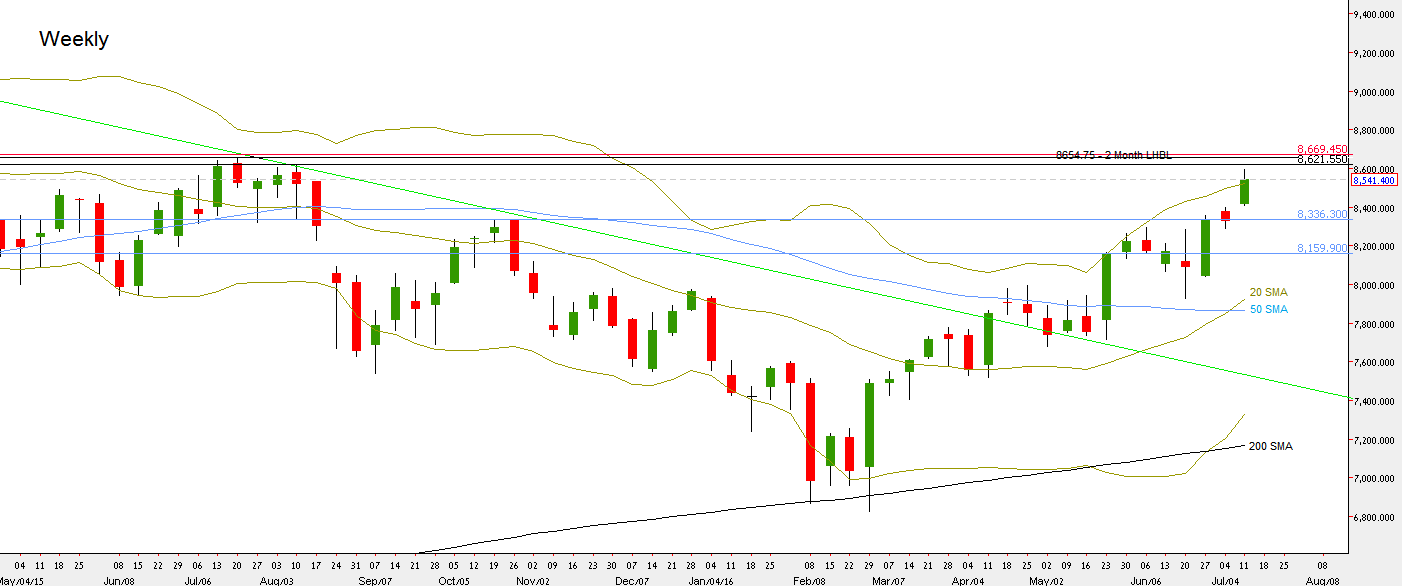
Nifty Futures: Weekly chart (at the courtesy of netdania.com)
Disclaimer: Anyone who takes action by this article does it at his own risk and understanding, and the writer won’t have any liability for any damages caused by this action.
