
Another small range week has passed over the Dollar Index, this time showed some sign of strength. The Weekly bar has printed a HH HL bar, closing finally (as the news from Turkey showed up) above the Weekly 50 SMA (Friday Daily bar closed above the 200 SMA).
The Quarterly High has still been respected. Again, as mentioned in the previous reviews, this Quarterly High is the most important indication as for the midterm direction. Taking out that high, especially having a follow through right after (i.e. not just a misleading Upthrust), means by most chances that the Dollar Index is midterm bullish. Maybe not bullish as for taking out the Yearly High – yet, but neither ready for a big bearish wave down.
As long as the Quarterly High at 96.865 is being respected, we should assume that the current sideways price action is a distribution for another bearish wave, part of the Yearly correction since March 2015, many chances for the target to be around the 87 level. If this potential wave is going to emerge soon, it can be counted as Elliott Wave 5 of the C leg of the whole decline since March 2015 (see the chart). The Quarterly High mentioned above is the exact 61.8% retracement of the previous wave (Wave 3).
Currently, the most important trigger to indicate that most likely the bearish wave has started is taking out the Weekly swing Low at 95.375.
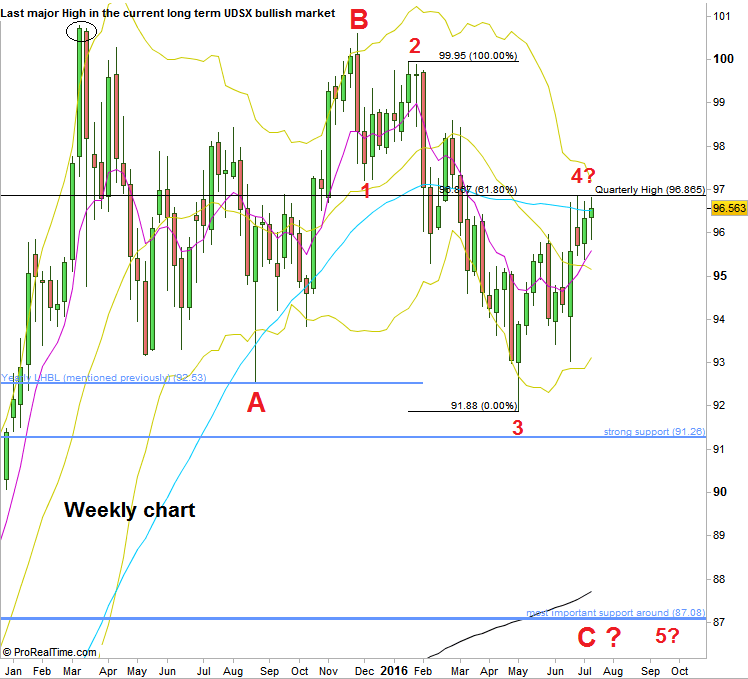
Dollar Index: Weekly chart (at the courtesy of prorealtime.com)
Disclaimer: Anyone who takes action by this article does it at his own risk and understanding, and the writer won’t have any liability for any damages caused by this action.
