
Two weeks after the Brexit pole, the market looks very strong, and currently is above the highest price prior to the pole.
Taking out the High of April at 18083, only 4 points from the High of last Friday is a bullish setup to reach the 19100 level area. It is the same signal as taking out the High of the last Quarterly bullish pinbar on sloping 8 EMA, and the target is the same pinbar amplitude (19100 area). The stop for this wide move is below the Quarterly Low, at 16961, not practical for the retail trader.
If the market does take out this 18083 level, the next highs to conquer are also very likely to be taken out within the same bullish momentum, the High of 23-JUN-2015 at 18108 is almost certain to be taken out, and very likely the next High at 18163 (the High of June 2015) as well.
The current Weekly price action calls for another testing of the Weekly midrange at 17500, and it may take place if the above Highs are taken out. If that happens, then good bullish signs after testing the mid range may give a better R/R setup for the next bullish move (if/when).
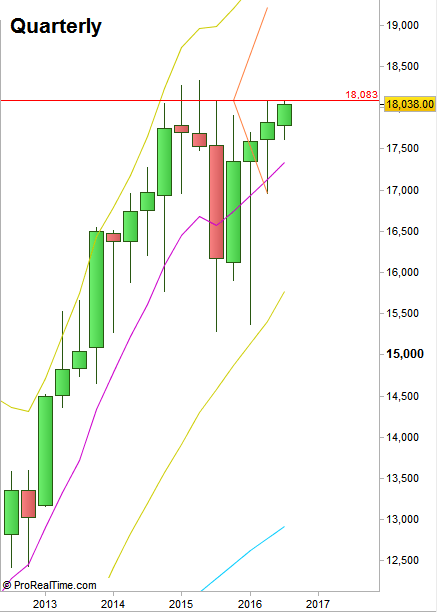
DOW Futures : Quarterly chart (at the courtesy of prorealtime.com)
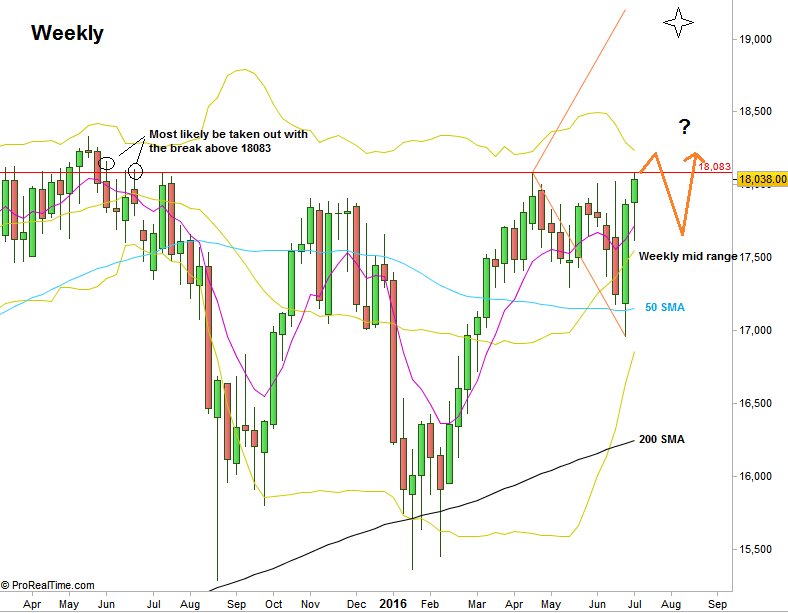
DOW Futures: Weekly chart (at the courtesy of prorealtime.com)
Disclaimer: Anyone who takes action by this article does it at his own risk and understanding, and the writer won’t have any liability for any damages caused by this action.
