As mentioned in the last review, the most important bar indication for the next move is the Quarterly bullish pinbar leaning on the 8 EMA as well as on the Yearly LHBL line mentioned couple of times before (92.53, blue). Taking out its High, which is the Weekly Swing High at 96.865 mean that this whole passing Quarter was a false break down of the big range since year 2015, hence is bullish, and may challenge the top of the range at 100.785.
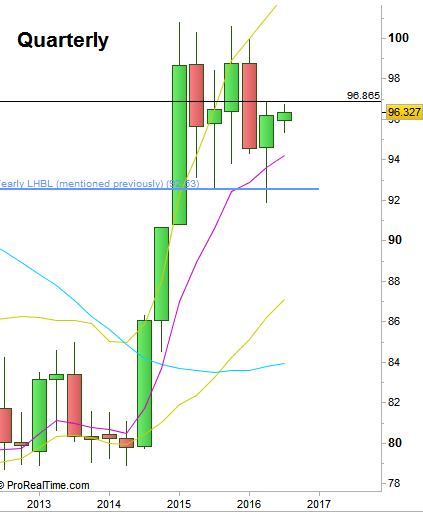
Dollar Index : Quarterly chart (at the courtesy of prorealtime.com)
The lower timeframes reveal that something is “crawling” in achieving this bullish indication. This is the 3rd week that punctures the Weekly 50 SMA but like the formers, unable to close above it, a clear sign of weakness. This week, although seems somewhat bullish, printed a LH LL bar.
The inability of the price to get over the resistance here is pointing that we see currently smart distribution, in this case for a new bearish wave that might start from here, Wave 5 (Elliott Waves), targeted most likely at the 87 area (covered in the previous 2 reviews).
A good bearish trigger can emerge if on Monday (and only by Monday) the price takes out the Daily Low at 95.78 – without taking out the Daily High first. Stop at the Daily High. Otherwise (i.e. market doesn’t make a Daily LL on Monday), as long as the market doesn’t take out the Quarterly High at 96.865, but takes out the Daily swing Low later on (which is the Weekly Low at 95.375) – is a good bearish signal.
The target for this bearish signal in both cases is the support at the 94.20 area. It is recommended to cover half of the position, and try to maximize the rest, as the current price action might turn into the end of the distribution and a mark down.
Not having a Daily thrust down on Monday and a support of the daily bars later above the Weekly Low raises the chances for more sideways action which for the bearish case means that the assumed distribution hasn’t been over yet.
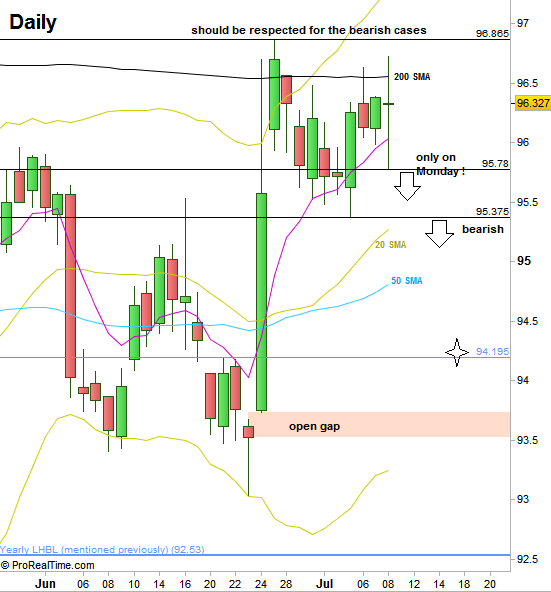
Dollar Index: Daily chart (at the courtesy of prorealtime.com)
Disclaimer: Anyone who takes action by this article does it at his own risk and understanding, and the writer won’t have any liability for any damages caused by this action.