“Off The Grid” Indicators Reveal True State Of U.S. Economy
Summary: Our basket of unorthodox economic indicators shows a U.S. economy that is growing, but at a very slow pace and with a notable sense of social unease. On the plus side, used car prices are defying all expectations by remaining robust – that helps trade-in values for new car purchases. Dealer inventories of new cars are also in good shape. Food stamp program participation is trending lower, although +44 million Americans (14% of the total population) still need government assistance to eat. On the cautionary side of the coin, large pickup truck sales have turned negative – a proxy for small business confidence in a range of industries. Consumer spending per day is declining, and our Bacon Cheeseburger Index is still flashing a deflationary warning. Lastly, the FBI reports that there have been 11.7 million background checks for firearm sales through May. At this rate, total year sales could reach 28 million, versus 8-9 million before the Financial Crisis.
We’ve been doing these “Off the Grid” indicator reports for years, and the most common question we get about them is “Why”? As in “Why do we care about data points that policymakers don’t talk about?” And “Why does any of this matter?”
Now we have an example of why: Brexit. To look at the standard economic talking points, the British people should have been happy to go with the status quo and “Remain”. Consider these customary measures of employment, inflation, output, and well-being:
Current unemployment at 5%, and much lower joblessness than other developed economies after the Financial Crisis and Great Recession. Peak unemployment post 2000 was 8.5% in 2011 – better than the US and most European countries.
Inflation is running less than 1% – lower than what policymakers like to see, but very friendly to consumers. The worst things got were in 2008, when inflation peaked at 4.8%.
GDP Growth shows none of the quarterly volatility of the US economy, and has run between 2.2% and +5% since 2011.
Income inequality, according the GINI Index, is 32.4 – on par with Canada (32.1), Ireland (33.9) and better than Japan (37.9).
Large scale political outcomes – the kind that can move markets – are more than a function of simple economics. That’s why we look at a range of datasets that we call “Off the Grid Indicators”. There are numerous graphs and tables available in the attachment to this email.
Here’s the highlight reel:
On the plus side of the ledger:
The auto industry is a large employer of American workers who do not have a college degree. This cohort has had a tough economic time since before the Financial Crisis, and auto industry jobs pay well. Keeping auto assembly plants running at stable line rates (and avoiding even temporary layoffs) is therefore important to this often overlooked cohort.
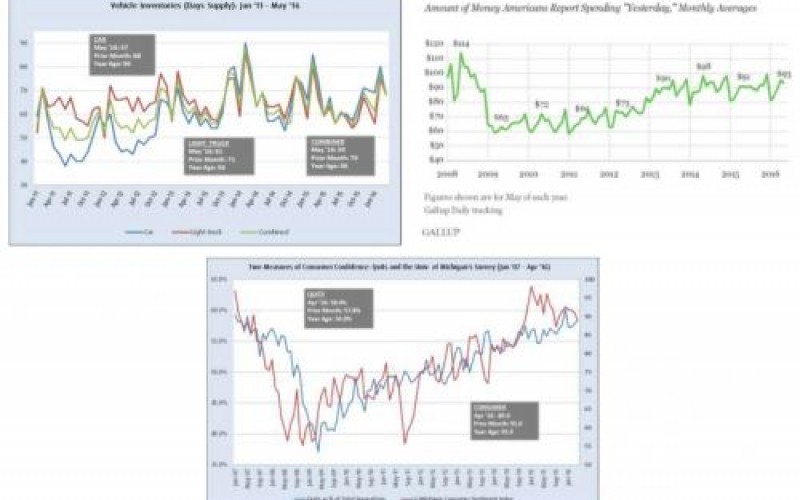
Currently, dealer inventories of cars and trucks are in good shape at 59 days supply. The ideal number is 60. This means as long as light vehicle demand remains constant, automakers can keep to their Q2 and Q3 build schedules.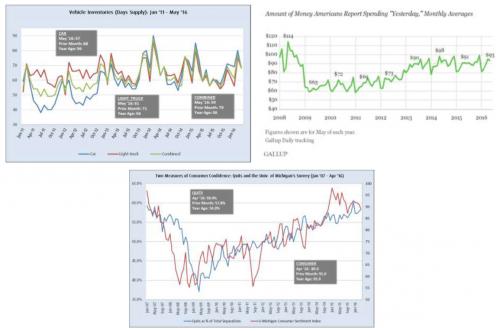
Used car prices remain surprisingly robust. Auto auction company Manheim publishes an index of used vehicle values, and the most recent data shows prices remain at 2011 levels. That’s a positive for new car and truck demand, since potential buyers usually have a vehicle to trade in at the dealer or sell privately. The better the value of that car or truck, the more likely the consumer will be able to afford a new vehicle.
Fewer people are Googling “I want to sell my kidney”. No joke – this has been a top 3 autofill for Google when you enter “I want to sell my” for the last 2 years. It has been replaced with “Furniture”.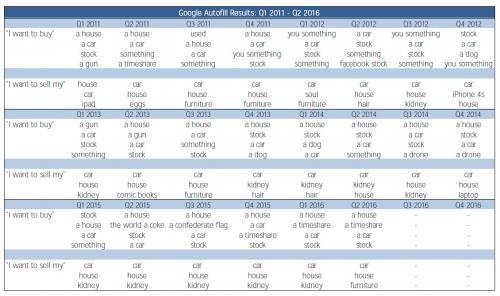
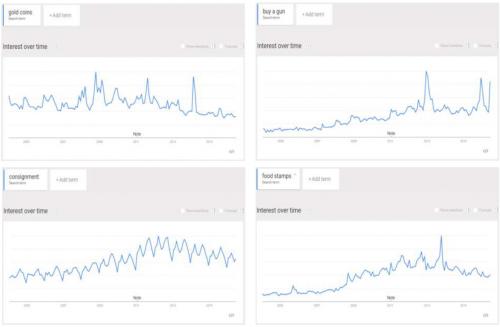
Participation in the Supplemental Nutrition Assistance Program (aka food stamps) is slowly declining. The most current roster has 44.3 million Americans in the program, down from 45.6 million a year ago. It is hard to say how much of this is better economic conditions versus reductions in coverage (childless single people have become illegible for the program in some states). Worth noting: even at 44 million people, that is still 14% of the entire US population. Before the Financial Crisis, there were less than 25 million in the program.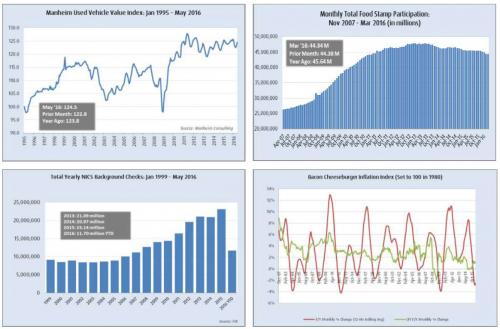
And some points of concern:
Large pickup truck sales are down year-over-year. This is one of our favorite indicators of small business growth in “Real America” (i.e. not coding the latest food delivery or dating app). May sales were down 3.1% from last year, one of the worst comparisons since mid 2011.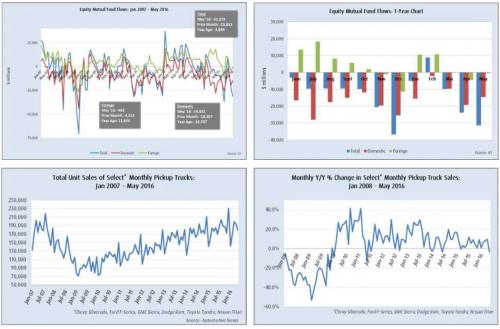
Gallup’s consumer survey of daily spending patterns shows the average American spending $ 93/day in out of pocket expense, up from $ 91/day last year but lower than the $ 98/day of 2014.
People are buying more precious metals than mutual funds. The six month rolling averages of U.S. Mint sales of gold and silver bullion coins are: $ 85 million (Silver) and $ 65 million (Gold). Both are higher than a year ago. By contrast, US mutual funds have seen a total of $ 31 billion in redemptions this year.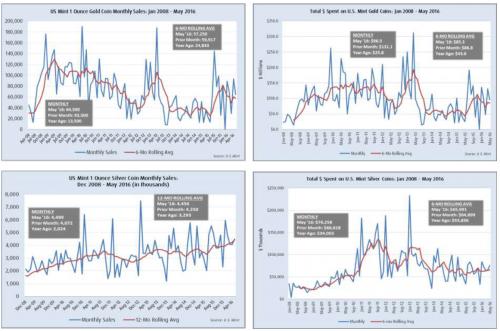
Our Bacon Cheeseburger Index – an equal weighted measure of the CPI inputs for bacon, ground beef and cheese – is still in deflationary territory for the second consecutive quarter at -2.5%. Don’t laugh – this measure of real world inflation (and therefore one that informs consumer expectations) was flashing a warning sign long before Chair Yellen and the Fed publicly revised their long term growth forecasts lower earlier this month.
We’ll close on one point that isn’t so much economic as social – the number of FBI background checks for firearm sales. This data is available monthly, and through May it shows that Americans have done the paperwork to make 11.7 million legal purchases of one gun or more. Taking that as a run rate for the year, 2016 could see 28 million firearm sales using the FBI check data as a proxy for transactions. That compares to a three year rolling average of 21.7 million. Since 2007, the FBI has processed over 150 million firearm purchase background checks. That is one for every two Americans.
This is obviously a hot topic issue in a presidential election year, and we have no desire to touch this particular third rail of American politics. From an economic and social standpoint, however, we think it is important to understand the numbers behind the debate. Before the Financial Crisis, the FBI typically processed 8-10 million checks per year. This year, that number might be 3x higher. That is a lot of guns.