Take 5: Consider Stocking Up on Gilead Sciences
Gilead Sciences Inc. (NASDAQ:GILD), is a research-based biopharmaceutical company that discovers, develops and commercializes innovative medicines. Gilead’s primary areas of focus include HIV, liver diseases such as chronic hepatitis C virus (HCV) infection and chronic hepatitis B virus (HBV) infection, oncology and inflammation, and serious cardiovascular and respiratory conditions. The company’s HIV products include Stribild, Complera/Eviplera, Atripla, Truvada, Viread, Emtriva, Tybost and Vitekta. It also has products for liver diseases including: Harvoni, Sovaldi, Viread and Hepsera. Zydelig is the Gilead’s oncology product. Its cardiovascular products include the following: Letairis, Ranexa and Lexiscan/Rapiscan. Its Respiratory products include both Cayston and Tamiflu. Gilead also has other products including AmBisome and Macugen.
Market outlook
Gurus
A number of gurus have recently purchased the stock including the following: Julian Robertson(Trades, Portfolio), Jim Simons (Trades, Portfolio), Louis Moore Bacon (Trades, Portfolio), Jeff Auxier (Trades, Portfolio), Pioneer Investments (Trades, Portfolio), Paul Tudor Jones (Trades,Portfolio), John Buckingham (Trades, Portfolio), Ken Fisher (Trades, Portfolio) and Murray Stahl(Trades, Portfolio).
- GILD 15-Year Financial Data
- The intrinsic value of GILD
- Peter Lynch Chart of GILD
There were number of gurus who reduced their positions in GILD last quarter including T Rowe Price Equity Income Fund (Trades,Portfolio), David Dreman (Trades, Portfolio),John Keeley (Trades, Portfolio), Joel Greenblatt (Trades, Portfolio), John Burbank (Trades, Portfolio), Ray Dalio (Trades, Portfolio), Mario Gabelli (Trades, Portfolio), Ronald Muhlenkamp (Trades, Portfolio). Dodge & Cox, and NWQ Managers (Trades, Portfolio).
Visit Gilead’s Guru trades page for more info.
Analyst consensus estimates (ACE)
Analyst consensus estimates for the price of the stock ranges from $ 81.89 to $ 123.37.
Industry/Sector Fair Value
Industry > Healthcare > Biotechnology
April 11, 2016 = 0.81
July 16, 2015 52-week high = 1.06
Feb. 9, 2016 52-week low = 0.70
Aug. 2, 2005 all-time high = 1.44
March 6, 2009 all-time low = 0.61
For more information, click here.
Financial strengths
Growth
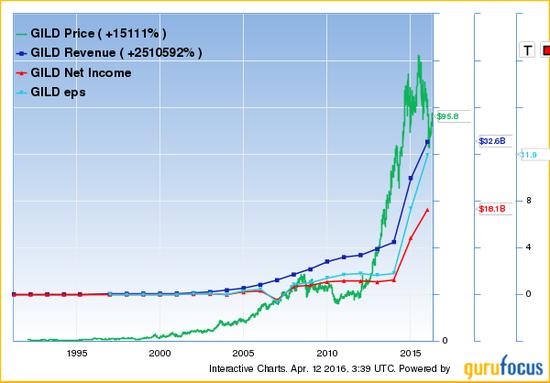
GILD has very strong growth. Three-year revenue growth was 51.80%, while three-year EPS growth was 93.70%

Effective profits
How do you measure if a company has effective profits? Warren Buffett (Trades, Portfolio)’s answer is the best!
- Buffett thinks that the best kind of business to own is one with high profit margins and high turnover.
- Buffett believes the second-best kind of business to own is one with either high profit margins or a high turnover to compensate for lower profit margins.
- Buffett is not interested in owning a business with both low profit margins and low turnover.
Analyzing effective profits is also very important and can be broken down into two components: margins and turnover. As a result, companies can also be broken into four quadrants.
The best companies are in quadrant 1 (the company is selling very profitable products/services and a lot of them, like Microsoft); the runner ups are in quadrant 2 (the company is selling low profitable products/services but a lot of them, like Walmart) and quandrant 3 (the company is selling very profitable products/services but not a lot of them, like Rolex); and the companies to avoid are in quadrant 4 (the company is selling low profitable products/services and not a lot of them, like a failed discount DVD store because people are now using Netflix and the internet for entertainment).
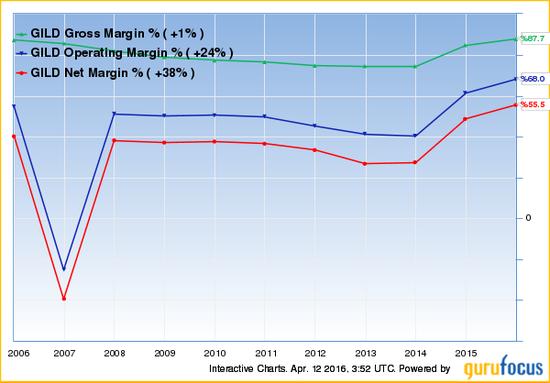
The company has been very profitable, too. Operating margin is 68%, while net margin is 55.48%.
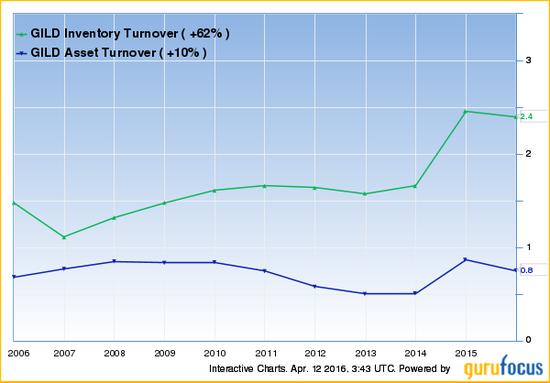
Inventory turnover has been increasing and is a good sign.
Efficient cash conversion cycle
You may have heard the phrase “cash is king!” How efficient is the company in generating cash from sales? How is it managing and collecting on its sales? How is the company managing its inventory? How good is the company at paying/financing its bills? These questions can be answered by analyzing how efficient is the cash conversion cycle.
CCC = number of days between disbursing cash and collecting cash in connection with undertaking a discrete unit of operations.
CCC for products companies = days sales outstanding (DSO) + days sales in inventory (DSI) – days payable outstanding (DPO)
The cash conversion cycle is a model that focuses on the length of time between when the company makes payments and when it receives cash inflows. The metric expresses the length of time in days that it takes for a company to convert resource inputs into cash flows. The cash conversion cycle attempts to measure the amount of time each net input dollar is tied up in the production and sales process before it is converted into cash through sales to customers. This metric looks at the amount of time needed to sell inventory, the amount of time needed to collect receivables and the length of time the company is afforded to pay its bills without incurring penalties. This is also known as the “cash cycle.”
Days sales outstanding (DSO) = accounts receivables collection period = receivables / (sales / 360)
DSO is one of the key metrics for analyzing and identifying possible revenue shenanigans. Days sales outstanding is the average length of time required to convert the firm’s receivables into cash (to collect cash following a sale). A measure of the average number of days that a company takes to collect revenue after a sale has been made. A low DSO number means that it takes a company fewer days to collect its accounts receivable. A high DSO number shows that a company is selling its product to customers on credit and taking longer to collect money.
Days sales in inventory (DSI) = inventory conversion period = inventory / (cost of goods sold / 360)
DSI is one of the key metrics for analyzing and identifying possible inventory shenanigans. Days sales in inventory is the average time required to convert materials into finished goods and then sell those goods. A financial measure of a company’s performance that gives investors an idea of how long it takes a company to turn its inventory (including goods that are work in progress, if applicable) into sales. Generally, the lower (shorter) the DSI the better, but it is important to note that the average DSI varies from one industry to another.
Days payable outstanding (DPO) = payables deferral period = payables / (cost of goods sold / 360)
DPO is one of the key metrics for analyzing and identifying possible operating expenses shenanigans. Days payable outstanding is the average length of time between purchases of materials and labor and the payment of cash for them. A company’s average payable period. Days payable outstanding tells how long it takes a company to pay its invoices from trade creditors, such as suppliers. It isn’t always negative if you see this ratio is increasing. For example, Home Depot (HD) delayed paying its suppliers and its DPO went from 21 days to 41 days. This move was justified because Home Depot’s competitor Lowe’s (LOW) paid its suppliers in about 40 days at the time. By increasing DPO, Home Depot was able to free up more cash flows.
Gilead’s cash conversion cycle has been increasing. Its DSO is currently 65.46, which has been steady (they’ve been consistent in collecting on sales). DSI is 169.03, which has been decreasing (they have been more efficient with their inventory management). Finally, DPO is 107.33, which has been increasing (taking longer to pay creditors) and may be a yellow flag of deteriorating quality.
Returns
Like in tennis, a good return is crucial to winning the game. Returns are a very important measure of a company’s financial health. Its history, trend and forward estimates will affect the stock’s price. Therefore, improving your fundamental analysis of a company’s returns should help you increase gains from your investments.
Please note that you should compare the company’s return to its competitors, industry and sector when you are evaluating a company’s returns. Each company operates in a different industry and sector. Therefore results across different industries and sectors carry different risks, returns and averages.
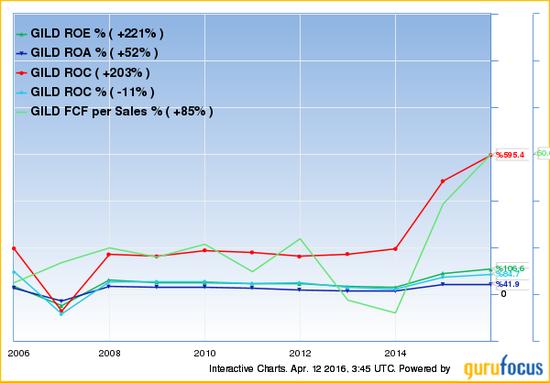
Return on equity (ROE)
If you had to teach a child about investment returns, one of the first investing songs they may learn perhaps may be entitled, “ROE-ROE-ROE your Float.” All kidding aside, ROE is one of Warren Buffett (Trades, Portfolio)’s measures of a healthy company.
ROE measures the efficiency with which a company uses shareholders’ equity and is a great overall measure on returns on capital. (Note: A flaw in using ROE is a company can take on a lot of debt and boost ROE without becoming more profitable therefore you should look at Return on Invested Capital).
ROE = net income / shareholder’s equity
Return on assets (ROA)
ROA measures how much income a company generates per dollar of assets. Investopedia define ROA as follows: “An indicator of how profitable a company is relative to its total assets. ROA gives an idea as to how efficient management is at using its assets to generate earnings. Calculated by dividing a company’s annual earnings by its total assets, ROA is displayed as a percentage. Sometimes this is referred to as ‘return on investment’.”
ROA = net income / total assets
Return on invested capital (ROIC)
ROIC combines the best in both worlds by measuring the return on all capital invested in the firm (both debt and equity). Does the company show a consistently high return on total capital above 12%?
ROIC = net income / average total capital
Return on capital (ROC)
ROC = EBIT / (net working capital + net fixed assets)
EBIT is used because companies operate with different levels of debt and differing tax rates. By using EBIT, you can compare the operating earnings of different companies without the distortions arising from differences in tax rates and debt levels.
Net working capital plus net fixed assets (or tangible capital employed) was used in place of total assets (used in ROA) or equity (used in a ROE). This figures out how much capital is actually needed to conduct the company’s business. Net working capital is used because a company has to fund receivables and inventory. Net fixed asset is used because a company has to fund the purchase of fixed assets to conduct business (i.e. real estate, plant and equipment).
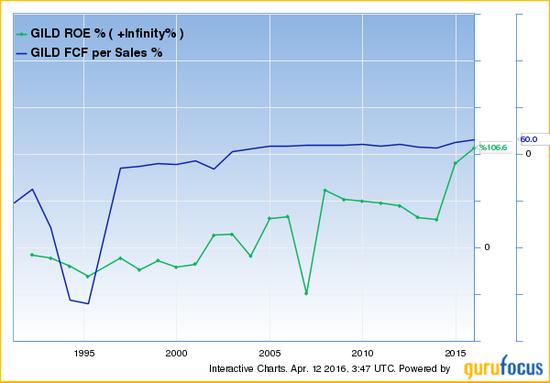
Return of free cash flow (FCF) per sales
Free cash flow (FCF) = cash flow from operations – capital spending
Return of free cash flow (FCF) per sales = FCF / sales
Anything above 5% is doing a solid job at generating excess cash. Combining this ratio with ROE, you can divide companies into four categories.
Companies in quadrant 1 are likely wide economic moat companies; companies in quadrant 2 and 3 are less desirable; while companies in quadrants 4 likely the least desirable companies.
Risks
Business risks
According to Yahoo! Finance, GILD’s Beta is 1.25203. This suggests that the stock is more risky than the average stock. If the market goes up 10%, this stock tends to go up 12.52%. Conversely, if the market drops 20%, this stock tends to go down 25.04%. This generally makes sense because Biotechnology/Pharmaceuticals tend to be more risky that the average stock.
Financial risks
Leverage ratios
GILD long-term debt to total assets ratio increased from December 2014 (0.34) to December 2015 (0.41). This may suggest that the company is progressively becoming more dependent on debt to grow their business.
Interest coverage ratios
GILD’s operating income for the three months ended in December 2015 was $ 5,621 million. Gilead’s interest expense for the three months ended in December 2015 was $ -230 million. Therefore, GILD’s interest coverage for the quarter was 24.44. The higher the ratio, the stronger the company’s financial strength is.
Valuations and margin of safety
Morningstar
Fair market value = $ 128.00
Consider buying = $ 89.60
Consider selling = $ 172.80
Fair value uncertainty = Medium
Economic moat = Wide
Stewardship = Exemplary
Growth = A
Profitability = A
Morningstar credit rating = A+
Value Line
Target price range = $ 115.00 to $ 175.00
Financial strength = A-
Appreciation potential = 15% to 70%
Reverse DCF model
Based on the following assumptions: current price of $ 95.83, a 4.0% terminal growth rate, an 11.0% discount rate, and additional assumptions (please see Reverse DCF Model), Adept Analyst’s estimates that the market is currently pricing the stock to have a 10-year average sales growth rate of 3.3%.
For more information, click here.
DCF model
Based on the following assumptions for a 10-year average growth rate at 8.5%, a 4.0% terminal growth rate, an 11.0% discount rate, and additional assumptions (please see DCF Model), Adept Analyst’s fair market value is $ 129.43.
For more information, click here.
Margin of safety
Based on the previous close of $ 95.83 and Morningstar’s fair market value of $ 128.00, the margin of safety is 25.13%.
Based on the previous close of $ 95.83 and Adept Analyst’s fair market value of $ 129.43, the margin of safety is 25.96%. Consider buying at $ 97.07 to achieve an approximate 25% margin of safety.
Conclusion
Based on the Take 5 analysis, Adept Analyst recommends stocking up on Gilead Sciences as of April 11. There is strong upside potential from holding this quality company.
GILD is a quality company with a wide economic moat.
If you believe what Buffett said that it is better to buy a great company at a fair price than a fair company at a great price, then you should buy GILD for the long term because this appears to be a great company at a fair price.

