How to Beat the Seven-Year Cycle
Last week, I revealed a major cycle that’s tied to some of the biggest economic downturns of the last 60 years.
Here’s a quick recap: The Jewish calendar moves in seven-year cycles starting at the moment of creation. The seventh year in the cycle is known as the sabbatical year, or “Shmita.” Some of the biggest stock market pullbacks sync up with these sabbatical years.
In fact, since 1950, the average return on the S&P 500 is negative during a Shmita year, excluding dividends!
This predictable cycle is helpful because pullbacks are the best time to pick up quality stocks at a discount.
By using a simple technical analysis, I’m going to show you how to trade these dips for major gains.
Step #1: Find the Dip
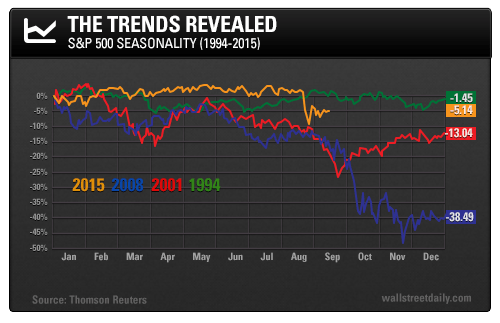
Over the last 20 years, the average sabbatical year return on the S&P 500 is -17.65%.
This chart measures relative sabbatical year performance of the S&P 500 from 1994 to 2015. As you can see, there are two distinct dips.
The first period lies between mid-March and mid-April. The S&P 500 dips and bottoms out in March.
The second and more significant dip occurs in the fall. While less clear-cut, this dip occurs between September and November.
Now that we know where they are, here’s how we profit.
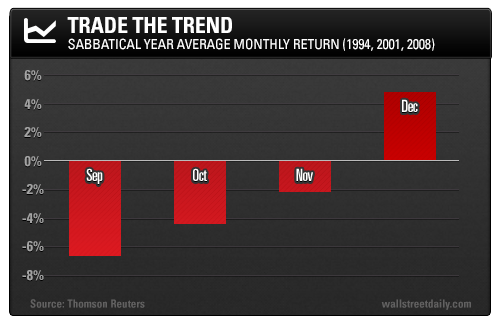
Step #2: Trade the Trend
You’ll also notice on the chart that two clear uptrends follow the spring and fall dips. Since 1994, April and December produced positive S&P 500 returns in every Shmita year.
April sabbatical year returns come in at 3%. And the S&P 500 has gained 5% in December during these years.
In 2015, a sabbatical year, the S&P 500 traded sideways from January to July. But true to the trend, stocks dipped in mid-March followed by an April uptrend.
Near the end of August, the U.S. stock market endured a flash crash, falling more than 1,000 points in a single day. This could be the major autumn dip, but with a potential interest rate hike looming, another fall is certainly possible.
Either way, watch the market closely and buy the November dip. When the market “wakes up” in December, you’ll walk away with fatter pockets.
On the hunt,
Jonathan Rodriguez