Invest When You Feel the Worst
Most of the damage has already been done.
If the stock market climbs a wall of worry, then we’re certainly primed for better news. There is certainly plenty to be concerned about.
The DJIA and the S&P 500 each reached official “correction” territory on Monday. The broad market has been hurt much worse than the cap-weighted indices, though.
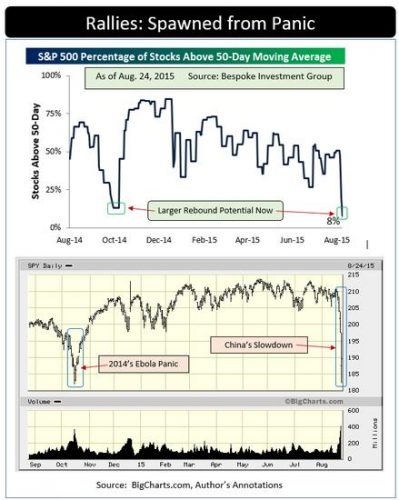
Bespoke Investment Group Research reported that, by day’s end, only 8% of all S&P 500 members were still trading above their 50-day moving averages. That is a rare occurrence. Last October’s final low seemed brutal yet never reached that oversold condition.
Traders who folded their portfolios into that Ebola-induced panic quickly regretted that decision. Within months the market had carved out a new all-time high.
Do any of you really make investment decisions based on Asian affairs? Did the “Debt Limit Crisis” keep stocks depressed for long? Remember the “Greek Bailout of 2011” ? How about the “Fiscal Cliff” of 2012?
Each of those events was very real and weighed heavily on share prices at those moments in time. None of them kept stocks down for more than a few months. A quick glance at the chart of the SPY confirms that many stocks which were already well below their 2015 peaks are now looking reasonably cheap.
Since the start of the current bull market only two corrections, 2010’s and 2011’s percentage drops, were larger than where we sit right now. The SPY is now off by about 12% from its intra-day all-time high.
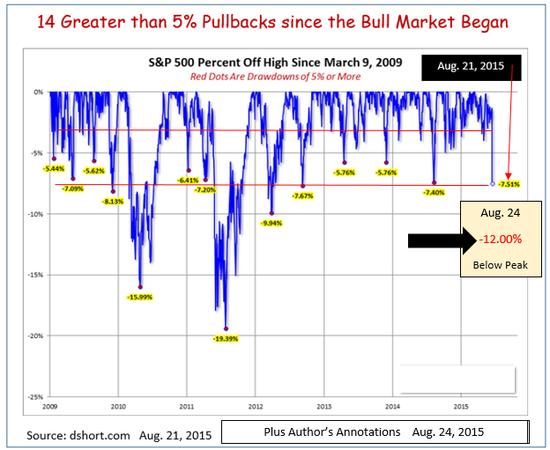
Those 2010 and 2011 retreats were very painful. In retrospect the recoveries, though, were pretty much V-shaped. Neither of those sell-offs lasted much longer than what we have already experienced time-wise since the last true top.
We could be closer to the final bottom than most people realize.
Invest accordingly.