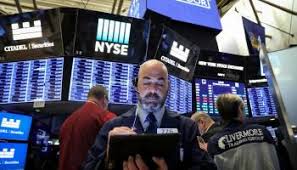
The Market May Be Hitting the Dreaded ‘Triple Top’—a Red Flag to Investors

While most investors are discussing the battle between tariffs pushing the stock market down or Fed interest rate cuts giving it another leg up, technical analysts are having a different discussion. Are we seeing a “triple top” formation? If so, that doesn’t bode well for anybody who has enjoyed a bull market that by most counts started way back in 2009.
Technical analysts track statistical trends, such as price movements and volume, to gauge investor sentiment, bullish or bearish. This type of analysis isn’t always the first thing investors think about—ask Peter Lynch and he’ll tell you fundamental components such earnings drive the stock market over time. But almost no trader—or hedge fund manager or investment banker for that matter—completely ignores what the numbers are telling them. And right now, there are certainly some red flags.
“We saw the formation of several bearish technical patterns taking shape,” says David Kudla, CEO of Mainstay Capital. The S&P 500, which started today at 2843, has been trading in a range for the past year and a half, hitting a high in almost exactly the same area three times: 2873, 2931, and 2946, then trading lower. In other words, if you invested at the high in the S&P 500 on January 21st of 2018, you’re actually below where you started. Analysts say the last indication of a triple top forming was in 2013, following highs going back to the 2000 dot.com boom. But it resolved itself by breaking through those resistance levels. In fact, it’s not a triple top unless the market actually falls through support. (The last time a triple top occurred was between 1965 and 1976, when the market fell more than 40%.)
The inability of the market to push higher—sometimes referred to as the level of resistance—is driven by many investor concerns, but the biggest one may be the fear of trade tariffs and their negative effects on the economy. The more times the market hits that resistance level without taking it out, the more negative it tends to be because it reflects an investor sentiment that money put into to the market will not return a profit any time soon. Therefore, why invest in the market at all?
But Kudla doesn’t think that’s the direction we’re going. “The rebound of just the past couple days has already changed that technical backdrop. Both the S&P 500 and DJIA have managed to break trend lines and move back above their 200 day moving averages. There is clearly an upward bias to the markets this week.”
Certainly Fed Chair Jay Powell has helped stabilize things. The weak ADP jobs report (just 27,000 new jobs in May according to the ADP), along with a downward revision for April, may have gotten the Fed’s attention. “Based on the weak jobs report, that greenlights the Fed to cut rates 50 basis points at the June meeting at the earliest or September at the latest,” says Tobin Smith, CEO and Founder of Transformity Research. “But if there’s no sugar from the Fed, the bottom of the trading range could break.” That would mean the S&P 500 could trade lower than 2416 as traders capitulate and get out of the market again, leaving the index looking for a new, and undetermined, support level.
Translated to the Dow Industrial Average, that would mean a fall of at least 3,000 points from current levels of around 25,700. That would not only qualify as a correction, but put the DOW within 5% of bear market territory. That’s why technical analysts are keeping a close eye on price movements.
On the other hand, many technical analysts see what could be an “inverted head and shoulders” formation. That would mean that the low in the market back in December of last year would form the head, and the trading that takes us higher would form the second shoulder. That is a bullish indicator and could lead to the new highs in the markets. And there are fundamentals backing up that perspective.
“I don’t believe it’s a triple top, but part of building a base,” says Gus Scacco, CEO and Chief Investment Officer of Hudson Valley Investment Advisors. He believes the Fed lowering rates would just be the start. “If the U.S. actually does lower rates, this will force most developing economies to cut rates to keep pace with the U.S.”
Guy Ortmann, Senior Technical Analyst at Scarsdale Securities, concurs. “First of all, the long term uptrend line remains intact (each high has been higher than the previous one), with the exception of last December, that I view as a real anomaly exacerbated by computer trading.” He also sees valuations of stocks generally improving. “Assuming a trade war doesn’t kill our forecasts, there is very high volume support around the 2780 level on the S&P.”
Perhaps the biggest threat to the stock market right now is money managers—and CEOs—doing nothing. “In the real economy, major executives with global exposure and global supply chains may just sit and wait and see how this show goes,” says Tobin Smith. “Why hurry?”
Waiting and watching is seldom good for an economy. Or the stock market.
More must-read stories from Fortune:
—This recession predictor just hit levels not seen since 2007
—Investment banks are pressing “play” on podcasts
—Rare earth metals aren’t the trade war weapon Beijing suggests
—These American stocks are born to run
—Listen to our new audio briefing, Fortune 500 Daily
Don’t miss the daily Term Sheet, Fortune‘s newsletter on deals and dealmakers.
