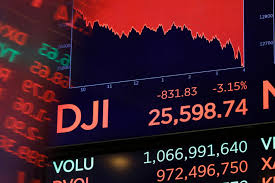
Is the Dow Jones Plunge Signaling the End of the Bull Market? Here’s What History Teaches Us About Bears

The 800-point drop of the Dow Jones Industrial Average on Oct. 10 may be a blip, and so could the nearly 5% decline over five days in the S&P 500. But they are also possibly leading indicators of the end of a historic bull market, in which stock-market indexes continue upward quarter after quarter.
Markets are cyclical, and experts only agree after the fact on what predicted an oncoming bearish period (and even then, often not). And right now tech stocks—like the trillion-dollar Apple—have dominated a significant part of the rise in value of the market as a whole. Jitters about those companies have led to this short-term fall, too, while drops were felt throughout the market. Rising interest rates from the Fed and a tight employment market don’t reassure investors, either.
A bear market by many definitions requires a drop of at least 20% in the S&P 500 from a bull-market peak; likewise, a bear market starts counting at a 20% rise out of a deep trough. Many stock-market observers pin the start of the current bull market, the longest since World War II, at March 9, 2009. As of October 10, it’s lasted 3,503 days. On August 22, it exceeded the previous record length, which ran October 1990 to March 2000.
Historically, almost all bear markets since World War II have started with consistent and significant ongoing declines, rather than simple volatility. Drops of 5% to 10%, or even higher, can occur during global financial and political uncertainty, but they’re paired with similar rises. Bear markets start with consistent average drops.
So, signs to watch for in the upcoming weeks and months aren’t volatility, but an average tendency for the market to head downward across any four-to-eight week period.
In the 1973–74 stock market crash, for instance, the S&P 500 peaked around 700 in December 1972, and then dropped a percentage point or two almost every month through October 1973, a 15% decline overall. But then it plummeted, crashing another 40% by September 1974, when it bottomed out. The index didn’t reach 700 again until 1987.
Bear markets since 1975 have had far lower percentage drops at their bottom, even as markets have grown remarkably in inflation-adjusted dollars. The following bull upswings more quickly regain lost ground and then exceed pre-bear highs.
Bull markets tend to end because of a defining event. In 1956, the Fed raised interest rates, while international events like the Suez Crisis and the Hungarian Revolution caused investors to pull back. In 1987, stocks dropped more than 20 percent on a single day—Black Monday, Oct. 19—after a strong rally crashed into the Persian Gulf turmoil and trade deficits.
The previous bear market, from October 2002 to October 2007, collapsed in the face of the global financial crisis, precipitated by raising interest rates in the face of inflation that revealed the vast scale of subprime mortgages and other badly collateralized loans.
The good news? Bear markets are short compared to bull runs. The most recent, starting in 2007, lasted about 2 1/2 years, though it took another four for the bull market to exceed highs reached in 2007.
