U.S. Stocks Are Twice as Expensive as in 2000, One Sales Gauge Shows
A knock against stocks is this: that the pervasiveness of gains since 2009 has made overvaluation a chronic problem across a broader-than-usual swath of the market. There’s nowhere to hide, the theory holds.
A valuation lens that tamps down the influence of the biggest companies highlights the danger. It’s the median price-to-sales ratio for members of the S&P 500. The measure, which de-emphasizes giant companies like Apple Inc. and Exxon Mobil Corp. by focusing on the center of the index, stands at 2.63 right now, compared with 1.23 in February 2000, data compiled by Leuthold Group showed.
The data reveal a more perilous valuation picture than one would get by looking at gauges that are skewed by a company’s market capitalization. By that approach, the S&P 500 traded at 2.2 times sales, in line with the peak levels seen 18 years ago.
To Doug Ramsey, Leuthold’s chief investment officer, the contrast highlights a key difference between now and the bubble years. Back then, overvaluation was highly concentrated to tech giants. Right now, everything is expensive.
“For the last year, we have labeled the S&P 500 price/sales ratio – which has returned to its Y2K bubble levels – the ‘scariest chart in our database,”’ Ramsey wrote in a note last week. “The addition transforms an already alarming chart into one that’s almost unfit for a family-friendly publication.”
Leuthold’s study adds to a growing list of caveats for a bull market that could become the longest in history this month. As the advance entered its 10th year, bears have touted everything from peak profits to higher interest rates to global trade tensions as reasons to bail.
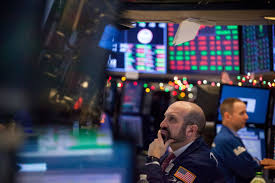
The S&P 500 rose for a fourth day as of 11 a.m. in New York, about 0.5 percent away from topping its all-time high reached in January.
The median price-sales ratio has been higher than it was in 2000 over the past five years and the market kept going higher. It’s not until the cap-weighted valuation reached the bubble level that alarms started ringing at Leuthold.
To be sure, viewed against earnings, a business yardstick that can be influenced by things such as cost cutting, share buybacks and tax cuts, stock valuations look more reasonable. At about 21 times profits, the S&P 500’s multiple is still about a third below levels seen in the dot-com era.
Yet Leuthold’s data raised a question about a phenomenon that equity bulls have found comfort in: Is wider stock participation a blessing or a curse for the market?
For now, many see wider breadth as a healthy sign that the advance is on a solid footing. But, with everything going up, that leaves little value left in the market.
“This breadth of overvaluation certainly helps explain today’s level of despondence among value managers,” Ramsey said. “They’ve suffered through a period of underperformance relative to growth and momentum that rivals the 1990s. But the long period of penance has not rewarded them with any truly cheap pockets of the stock market – like it did in 1999 and 2000.”