
| Symbol | Last | Change | % | High | Low |
|---|---|---|---|---|---|
| USD / JPY | 154.65 | +0.02 | +0.01% | 154.68 | 153.59 |
| Close | GMT Time : Sat Apr 20 2024 08:25 | ||||
USD/JPY : Intraday Live Chart
USD/JPY : Technical Signal Buy & Sell
| 5 Min Signal | 1 Hour Signal | 1 Day Signal |
|---|---|---|
| Buy | Buy | Buy |
USD/JPY : Moving Averages
| Period | MA 20 | MA 50 | MA 100 |
|---|---|---|---|
| 5 Minutes | 154.65 | 154.65 | 154.62 |
| 1 Hour | 154.61 | 154.52 | 154.52 |
| 1 Day | 152.66 | 150.90 | 149.72 |
| 1 Week | 148.11 | 145.97 | 140.99 |
USD/JPY : Technical Resistance Level
| Resistance 1 - R1 | Resistance 2 - R2 | Resistance 3 - r3 |
|---|---|---|
| 155.02 | 155.73 | 156.11 |
USD/JPY : Technical Support Level
| Support 1 - S1 | Support 2 - S2 | Support 3 - S3 |
|---|---|---|
| 153.93 | 153.55 | 152.84 |
USD/JPY : Periodical High, Low & Average
| Period | High Change from Last | Low Change from Last | Average Change from Last |
|---|---|---|---|
| 1 Week | 154.73 -0.08 | 152.59 +2.06 | 154.16 +0.49 |
| 1 Month | 154.73 -0.08 | 150.69 +3.96 | 152.24 +2.41 |
| 3 Month | 154.73 -0.08 | 146.24 +8.41 | 150.10 +4.55 |
| 6 Month | 154.73 -0.08 | 140.80 +13.85 | 148.43 +6.22 |
| 1 Year | 154.73 -0.08 | 133.41 +21.24 | 145.58 +9.07 |
USD/JPY : Historical Chart
Group by:
Related News


About USD / JPY 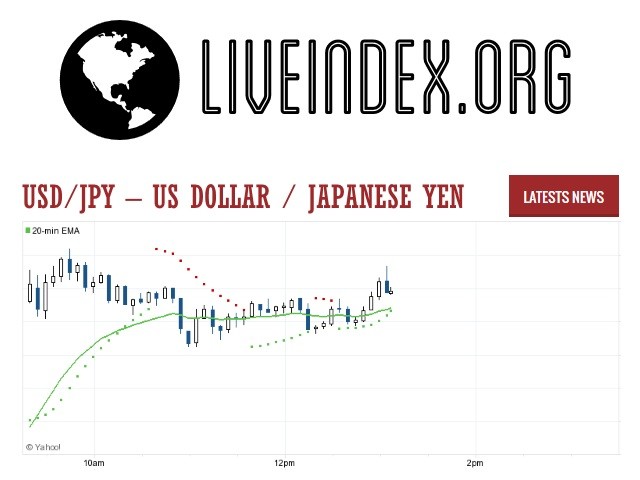
USD/JPY - US Dollar / Japanese Yen Currency Pair | USD/JPY Live Quotes | US Dollar / Japanese Yen Live Quotes
Live Price of USD/JPY. USD/JPY Live Chart, USD/JPY Intraday & Historical Live Chart. USD/JPY Buy Sell Signal, USD/JPY News, USD/JPY Videos, USD/JPY Averages, Returns & Historical Data
» USD/JPY
» USD/JPY Real Time Quotes
» USD/JPY Live Chart
» USD/JPY Intraday Chart
» USD/JPY Historical Chart
» USD/JPY Buy Sell Signal
» USD/JPY News
» USD/JPY Videos
» USD/JPY Averages
» USD/JPY Currency Pair
» USD/JPY Historical Data