
| Symbol | Last | Change | % | High | Low |
|---|---|---|---|---|---|
| USD / AUD | 1.5582 | +0.0009 | +0.06% | 1.5717 | 1.5546 |
| Close | GMT Time : Sat Apr 20 2024 04:56 | ||||
USD/AUD : Intraday Live Chart
USD/AUD : Technical Signal Buy & Sell
| 5 Min Signal | 1 Hour Signal | 1 Day Signal |
|---|---|---|
| Sell | Buy | Buy |
USD/AUD : Moving Averages
| Period | MA 20 | MA 50 | MA 100 |
|---|---|---|---|
| 5 Minutes | 1.56 | 1.56 | 1.56 |
| 1 Hour | 1.56 | 1.56 | 1.56 |
| 1 Day | 1.54 | 1.53 | 1.53 |
| 1 Week | 1.52 | 1.52 | 1.50 |
USD/AUD : Technical Resistance Level
| Resistance 1 - R1 | Resistance 2 - R2 | Resistance 3 - r3 |
|---|---|---|
| 1.5679 | 1.5745 | 1.5850 |
USD/AUD : Technical Support Level
| Support 1 - S1 | Support 2 - S2 | Support 3 - S3 |
|---|---|---|
| 1.5508 | 1.5403 | 1.5337 |
USD/AUD : Periodical High, Low & Average
| Period | High Change from Last | Low Change from Last | Average Change from Last |
|---|---|---|---|
| 1 Week | 1.5717 -0.0135 | 1.5284 +0.0298 | 1.5531 +0.0051 |
| 1 Month | 1.5717 -0.0135 | 1.5080 +0.0502 | 1.5341 +0.0241 |
| 3 Month | 1.5717 -0.0135 | 1.5007 +0.0575 | 1.5289 +0.0293 |
| 6 Month | 1.5909 -0.0327 | 1.4589 +0.0993 | 1.5242 +0.0340 |
| 1 Year | 1.5909 -0.0327 | 1.4495 +0.1087 | 1.5229 +0.0353 |
USD/AUD : Historical Chart
Group by:
Related News


About USD / AUD 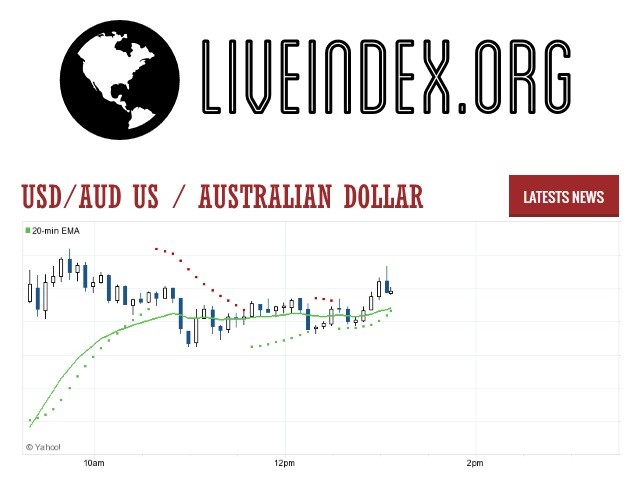
USD/AUD - US Dollar / Australian Dollar Currency Pair | USD/AUD Live Quotes | US Dollar / Australian Dollar Live Quotes
Live Price of USD/AUD. USD/AUD Live Chart, USD/AUD Intraday & Historical Live Chart. USD/AUD Buy Sell Signal, USD/AUD News, USD/AUD Videos, USD/AUD Averages, Returns & Historical Data
» USD/AUD
» USD/AUD Real Time Quotes
» USD/AUD Live Chart
» USD/AUD Intraday Chart
» USD/AUD Historical Chart
» USD/AUD Buy Sell Signal
» USD/AUD News
» USD/AUD Videos
» USD/AUD Averages
» USD/AUD Currency Pair
» USD/AUD Historical Data