
| Symbol | Last | Change | % | High | Low |
|---|---|---|---|---|---|
| OSE ALL SHARE – NORWAY | 1,570.95 | +9.15 | +0.59% | 1,575.89 | 1,562.20 |
| Open Last Trade : 15:40 | Norway Time : Wed Apr 24 2024 15:40 | ||||
OSE All Share : Intraday Live Chart
OSE All Share : Technical Signal Buy & Sell
| 5 Min Signal | 1 Hour Signal | 1 Day Signal |
|---|---|---|
| Buy | Buy | Buy |
OSE All Share : Moving Averages
| Period | MA 20 | MA 50 | MA 100 |
|---|---|---|---|
| 5 Minutes | 1572.69 | 1572.62 | 1572.62 |
| 1 Hour | 1564.78 | 1563.47 | 1563.26 |
| 1 Day | 1576.03 | 1534.52 | 1505.61 |
| 1 Week | 1510.12 | 1466.70 | 1422.75 |
OSE All Share : Technical Resistance Level
| Resistance 1 - R1 | Resistance 2 - R2 | Resistance 3 - r3 |
|---|---|---|
| 1,565.70 | 1,570.56 | 1,574.85 |
OSE All Share : Technical Support Level
| Support 1 - S1 | Support 2 - S2 | Support 3 - S3 |
|---|---|---|
| 1,556.55 | 1,552.26 | 1,547.40 |
OSE All Share : Periodical High, Low & Average
| Period | High Change from Last | Low Change from Last | Average Change from Last |
|---|---|---|---|
| 1 Week | 1,580.97 -10.02 | 1,547.16 +23.79 | 1,564.87 +6.08 |
| 1 Month | 1,608.91 -37.96 | 1,518.83 +52.12 | 1,565.94 +5.01 |
| 3 Month | 1,608.91 -37.96 | 1,426.90 +144.05 | 1,507.30 +63.65 |
| 6 Month | 1,608.91 -37.96 | 1,426.90 +144.05 | 1,508.52 +62.43 |
| 1 Year | 1,608.91 -37.96 | 1,346.18 +224.77 | 1,467.67 +103.28 |
OSE All Share : Historical Chart
Group by:
Related News


About OSE All Share – Norway 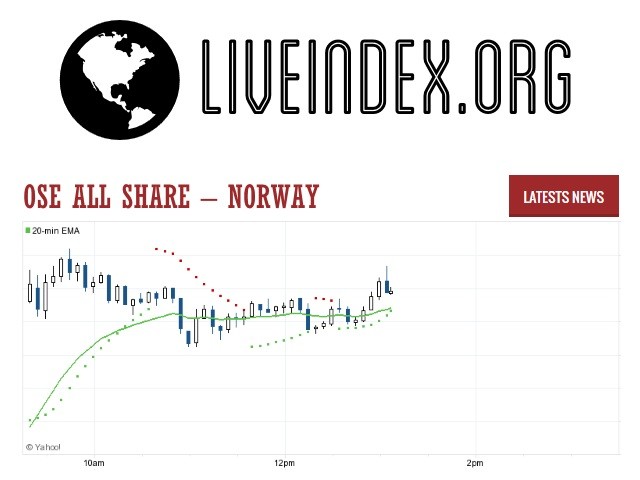
OSEAX is the index of Norway . It is traded in Oslo
OSE All Share - OSE All Share Index | OSE All Share Live Quotes | Netherlands Index
Live Price of OSE All Share. OSE All Share Live Chart, OSE All Share Intraday & Historical Live Chart. OSE All Share Buy Sell Signal, OSE All Share News, OSE All Share Videos, OSE All Share Averages, Returns & Historical Data
» OSE All Share
» OSE All Share Real Time Quotes
» OSE All Share Live Chart
» OSE All Share Intraday Chart
» OSE All Share Historical Chart
» OSE All Share Buy Sell Signal
» OSE All Share News
» OSE All Share Videos
» OSE All Share Averages
» OSE All Share Returns
» OSE All Share Historical Data