
| Symbol | Last | Change | % | High | Low |
|---|---|---|---|---|---|
| OMX – SWEDEN | 2,517.69 | +12.41 | +0.50% | 2,522.45 | 2,499.03 |
| Close | Sweden Time : Fri Apr 19 2024 08:57 | ||||
OMX 30 : Intraday Live Chart
OMX 30 : Technical Signal Buy & Sell
| 5 Min Signal | 1 Hour Signal | 1 Day Signal |
|---|---|---|
| Buy | Buy | Buy |
OMX 30 : Moving Averages
| Period | MA 20 | MA 50 | MA 100 |
|---|---|---|---|
| 5 Minutes | 2517.28 | 2511.34 | 2509.08 |
| 1 Hour | 2512.10 | 2506.00 | 2510.06 |
| 1 Day | 2511.68 | 2505.89 | 2436.92 |
| 1 Week | 2414.97 | 2206.81 | 2071.37 |
OMX 30 : Technical Resistance Level
| Resistance 1 - R1 | Resistance 2 - R2 | Resistance 3 - r3 |
|---|---|---|
| 2,531.61 | 2,547.93 | 2,556.83 |
OMX 30 : Technical Support Level
| Support 1 - S1 | Support 2 - S2 | Support 3 - S3 |
|---|---|---|
| 2,506.39 | 2,497.49 | 2,481.17 |
OMX 30 : Periodical High, Low & Average
| Period | High Change from Last | Low Change from Last | Average Change from Last |
|---|---|---|---|
| 1 Week | 2,548.28 -30.59 | 2,482.77 +34.92 | 2,508.44 +9.25 |
| 1 Month | 2,557.52 -39.83 | 2,476.61 +41.08 | 2,517.87 -0.18 |
| 3 Month | 2,557.52 -39.83 | 2,294.05 +223.64 | 2,447.97 +69.72 |
| 6 Month | 2,557.52 -39.83 | 2,036.88 +480.81 | 2,348.12 +169.57 |
| 1 Year | 2,557.52 -39.83 | 0.00 +2,517.69 | 2,256.54 +261.15 |
OMX 30 : Historical Chart
Group by:
Related News


About OMX – Sweden 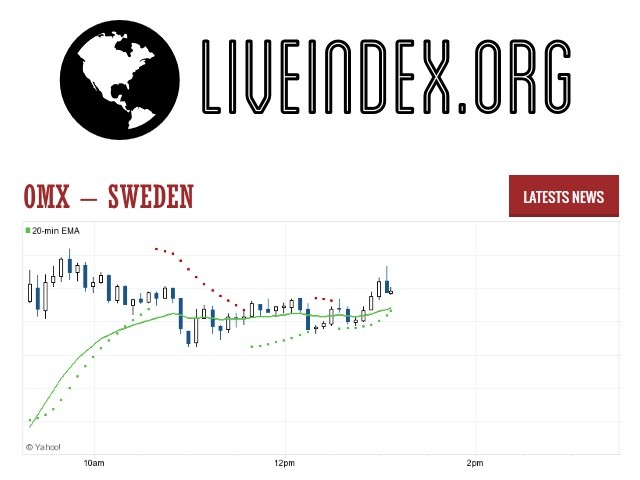
The OMX Stockholm 30 (OMXS30) is a stock market index for the Stockholm Stock Exchange. It is a market value-weighted index that consists of the 30 most-traded stock classes.
OMX - OMX 30 Index | OMX 30 Live Quotes | Sweden Index
Live Price of OMX. OMX Live Chart, OMX Intraday & Historical Live Chart. OMX Buy Sell Signal, OMX News, OMX Videos, OMX Averages, Returns & Historical Data
» OMX
» OMX Real Time Quotes
» OMX Live Chart
» OMX Intraday Chart
» OMX Historical Chart
» OMX Buy Sell Signal
» OMX News
» OMX Videos
» OMX Averages
» OMX Returns
» OMX Historical Data